
Bringing you the latest insights and research, helmed by our team of in-house economists, strategists and analysts, with more than 100 years of combined experience.
Learn more
SME Index
Real data. Real insights.
Measuring business health and performance of SMEs in Singapore.
The OCBC SME Index is the only quantitative index in Singapore powered by real transactional data from over 100,000 SMEs and 5 million data points with comprehensive coverage across industry value chains.
Real data. Real insights.
Gain insights into how SMEs are navigating disruptions and opportunities in digitalisation, transforming industries and shifting towards sustainability.
100,000
SMEs
5M
Data Points
WHO POWERS THE OCBC SME INDEX?
Across multiple industry value chains, each business is just 1 in over 100,000 SMEs that powers the OCBC SME Index.
Of the 700 responses collected from the SME Business Outlook Survey, sentiments among SMEs have improved marginally.
33% of respondents cited an improvement in their businesses and this represents a 2-percentage point rise from the poll conducted in March. In line with the OCBC SME Index reading, businesses from the outward-oriented sectors (37%) seems to be more optimistic compared to their peers in the domestically oriented sectors (29%). Meanwhile, majority of respondents (42%) indicated that business conditions have remained the same, and this is a 1-percentage point drop from the poll conducted in March.
Looking ahead, sentiments on the outlook have also improved slightly with fewer business owners expecting conditions to deteriorate in the near-term. 19% of the respondents see conditions worsening, and this is a 3-percentage point drop from 3 months ago. At the same time, there has been a corresponding 3-percentage point increase to SMEs expecting business conditions to remain status quo.
The survey findings were broadly consistent with trends observed in the OCBC SME Index and other economic indicators such as the PMI and NODX. Together, these point to resilient demand conditions continuing to support business activity despite elevated cost pressures.
Know where you stand in your industry then stand taller.
SME Index & GDP Nowcast Comparison
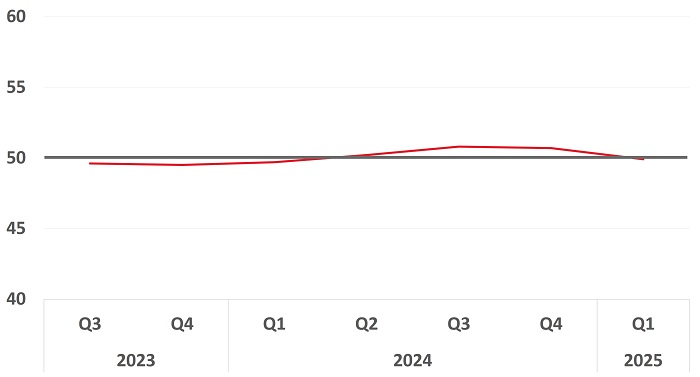
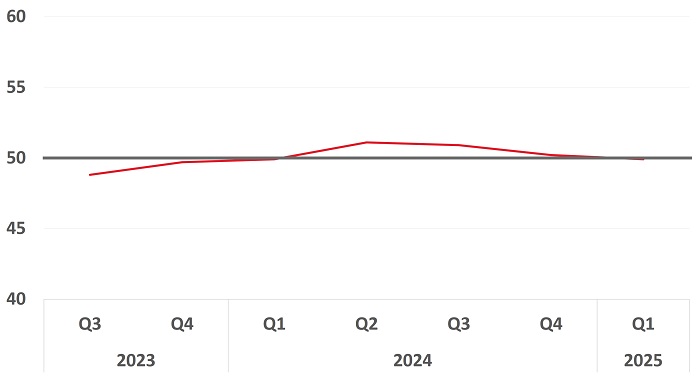
The OCBC SME Index is centred on a score of 50, which represents zero change in the inputs from a year ago. A reading above 50 indicates an improvement while a sub-50 reading indicates a deterioration relative to the same period a year ago.
The OCBC SME Index moderated to 51.3 in 2Q 2026, remaining in expansion amid prolonged geopolitical uncertainty arising from the Middle East conflict.
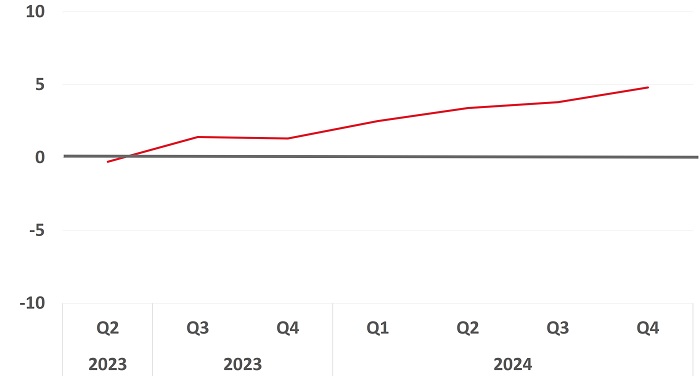
The GDP Nowcast estimates GDP using the latest OCBC SME Index.
The 2Q 2026 GDP nowcast based on the OCBC SME Index is around 5%, broadly in line with the advance GDP estimate released by the Ministry of Trade and Industry at 5.7%.
Expert insights

“The Singapore economy likely saw another quarter of resilient GDP growth in 2Q26 notwithstanding the start of the Middle East tensions and elevated energy prices.”
Selena Ling
Head of Treasury Research and Strategy
EXPLORE THE DATA
Discover the latest edition of the SME Index. It will help you identify where you stand within your industry value chain and understand the performance of your industry. Be nimble in spotting industry changes and trends.
Building & Construction
Building & Construction eased to 50.6 in 2Q 2026, with overall growth supported by businesses in the Construction (50.5) and Building Materials (50.8) segments. SMEs in the industry saw a sizable increase in both collections and payments, rising by 34.6% and 35.2% year-on-year respectively. This pronounced increase partly reflects a higher-cost operating environment, with elevated fuel, freight and construction material costs. Prices for key inputs such as ready-mixed concrete and steel reinforcement bars have increased following supply chain disruptions linked to the Middle East conflict, while freight costs also rose sharply, putting upward pressure on costs across the value chain.
Building & Construction eased to 50.6 in 2Q 2026, with overall growth supported by businesses in the Construction (50.5) and Building Materials (50.8) segments. SMEs in the industry saw a sizable increase in both collections and payments, rising by 34.6% and 35.2% year-on-year respectively. This pronounced increase partly reflects a higher-cost operating environment, with elevated fuel, freight and construction material costs. Prices for key inputs such as ready-mixed concrete and steel reinforcement bars have increased following supply chain disruptions linked to the Middle East conflict, while freight costs also rose sharply, putting upward pressure on costs across the value chain.
Building & Construction eased to 50.6 in 2Q 2026, with overall growth supported by businesses in the Construction (50.5) and Building Materials (50.8) segments. SMEs in the industry saw a sizable increase in both collections and payments, rising by 34.6% and 35.2% year-on-year respectively. This pronounced increase partly reflects a higher-cost operating environment, with elevated fuel, freight and construction material costs. Prices for key inputs such as ready-mixed concrete and steel reinforcement bars have increased following supply chain disruptions linked to the Middle East conflict, while freight costs also rose sharply, putting upward pressure on costs across the value chain.
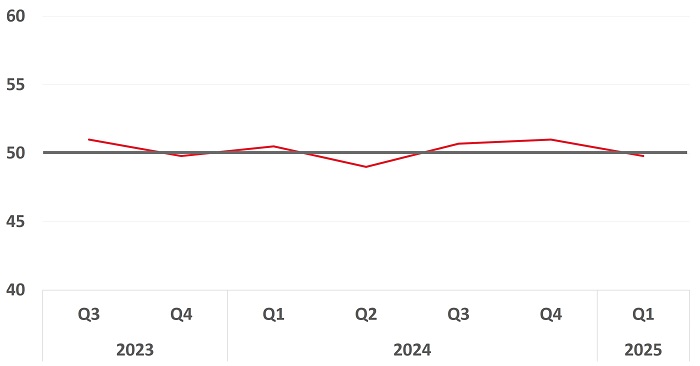
Building & Construction eased to 50.6 in 2Q 2026, with overall growth supported by businesses in the Construction (50.5) and Building Materials (50.8) segments. SMEs in the industry saw a sizable increase in both collections and payments, rising by 34.6% and 35.2% year-on-year respectively. This pronounced increase partly reflects a higher-cost operating environment, with elevated fuel, freight and construction material costs. Prices for key inputs such as ready-mixed concrete and steel reinforcement bars have increased following supply chain disruptions linked to the Middle East conflict, while freight costs also rose sharply, putting upward pressure on costs across the value chain.
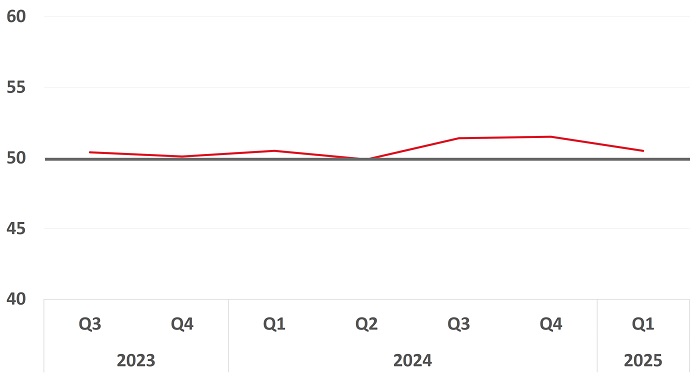
Building & Construction eased to 50.6 in 2Q 2026, with overall growth supported by businesses in the Construction (50.5) and Building Materials (50.8) segments. SMEs in the industry saw a sizable increase in both collections and payments, rising by 34.6% and 35.2% year-on-year respectively. This pronounced increase partly reflects a higher-cost operating environment, with elevated fuel, freight and construction material costs. Prices for key inputs such as ready-mixed concrete and steel reinforcement bars have increased following supply chain disruptions linked to the Middle East conflict, while freight costs also rose sharply, putting upward pressure on costs across the value chain.
Business Services
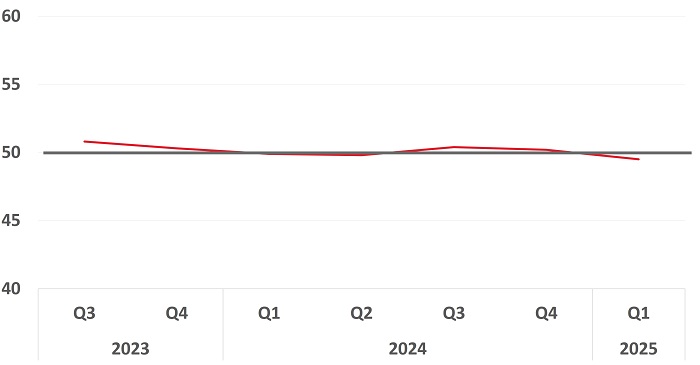
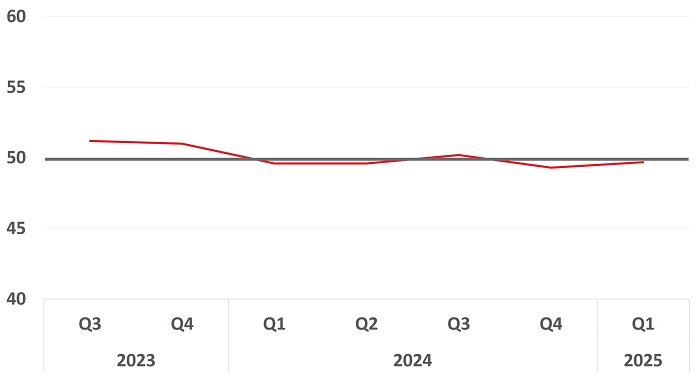
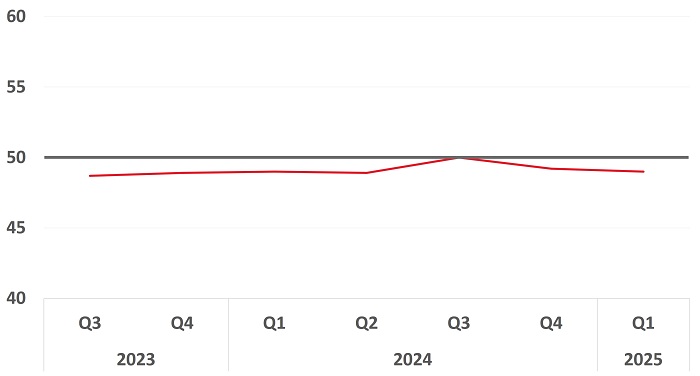
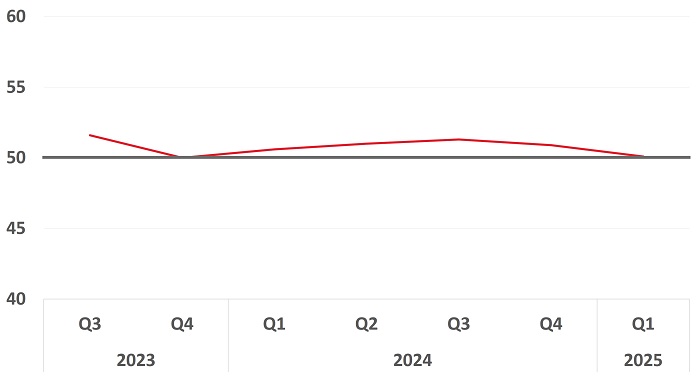
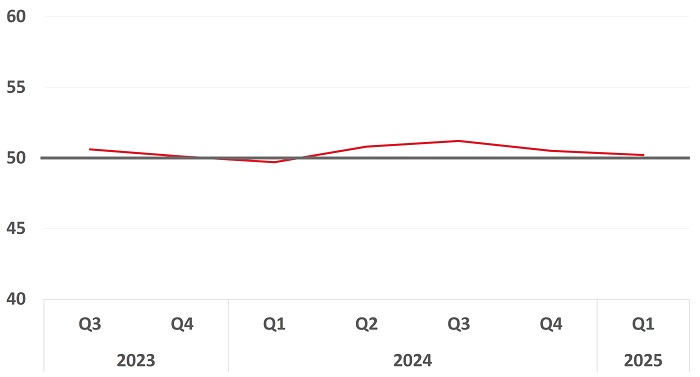
Business Services slipped into contraction with a reading of 49.7 in 2Q 2026. Overall performance was weighed down by Business Consultancy (49.9) and Advertising & Exhibition (49.2). SMEs in the latter segment have remained in contraction for the fifth consecutive quarter. Overall collections and payments grew year-on-year by 7.3% and 8.8%, respectively. The stronger growth in payments compared to collections suggests that SMEs in the services sector continue to face cost pressures but have limited their ability to pass these costs through to customers due to stickier prices.
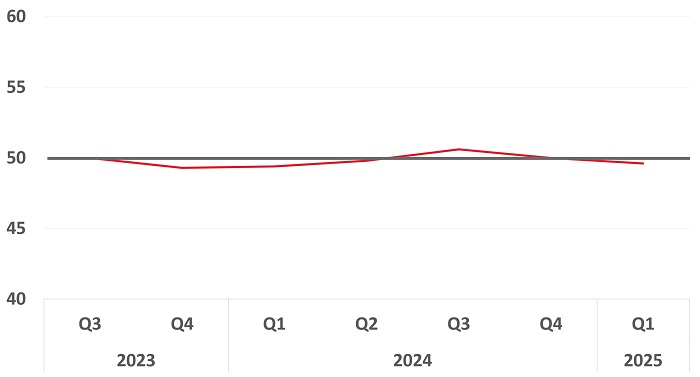
Business Services slipped into contraction with a reading of 49.7 in 2Q 2026. Overall performance was weighed down by Business Consultancy (49.9) and Advertising & Exhibition (49.2). SMEs in the latter segment have remained in contraction for the fifth consecutive quarter. Overall collections and payments grew year-on-year by 7.3% and 8.8%, respectively. The stronger growth in payments compared to collections suggests that SMEs in the services sector continue to face cost pressures but have limited their ability to pass these costs through to customers due to stickier prices.
Business Services slipped into contraction with a reading of 49.7 in 2Q 2026. Overall performance was weighed down by Business Consultancy (49.9) and Advertising & Exhibition (49.2). SMEs in the latter segment have remained in contraction for the fifth consecutive quarter. Overall collections and payments grew year-on-year by 7.3% and 8.8%, respectively. The stronger growth in payments compared to collections suggests that SMEs in the services sector continue to face cost pressures but have limited their ability to pass these costs through to customers due to stickier prices.
Business Services slipped into contraction with a reading of 49.7 in 2Q 2026. Overall performance was weighed down by Business Consultancy (49.9) and Advertising & Exhibition (49.2). SMEs in the latter segment have remained in contraction for the fifth consecutive quarter. Overall collections and payments grew year-on-year by 7.3% and 8.8%, respectively. The stronger growth in payments compared to collections suggests that SMEs in the services sector continue to face cost pressures but have limited their ability to pass these costs through to customers due to stickier prices.
Business Services slipped into contraction with a reading of 49.7 in 2Q 2026. Overall performance was weighed down by Business Consultancy (49.9) and Advertising & Exhibition (49.2). SMEs in the latter segment have remained in contraction for the fifth consecutive quarter. Overall collections and payments grew year-on-year by 7.3% and 8.8%, respectively. The stronger growth in payments compared to collections suggests that SMEs in the services sector continue to face cost pressures but have limited their ability to pass these costs through to customers due to stickier prices.
Education
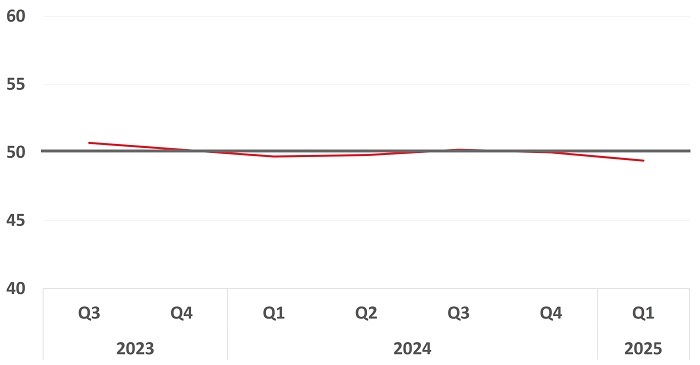
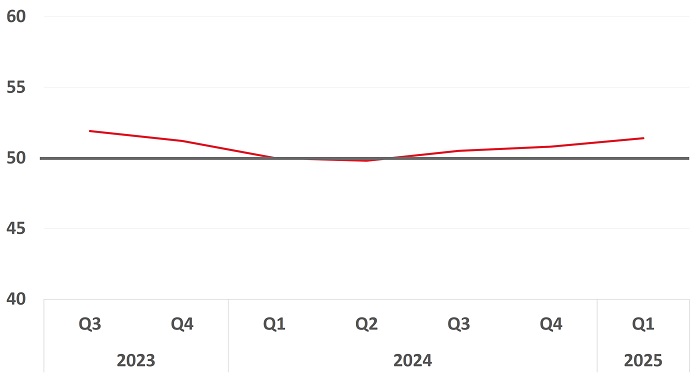
Education registered at 49.6, dropping into contractionary territory in 2Q 2026. Growth in Early Childhood Education (51.8) was outweighed by the contractions in Training Centres (48.4) and Formal Education & Commercial Schools (49.5).
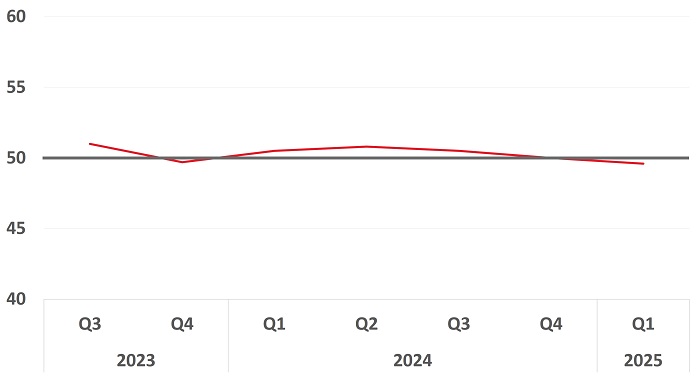
Find out more about how the education industry performed in the OCBC SME Index each quarter.
Education registered at 49.6, dropping into contractionary territory in 2Q 2026. Growth in Early Childhood Education (51.8) was outweighed by the contractions in Training Centres (48.4) and Formal Education & Commercial Schools (49.5).
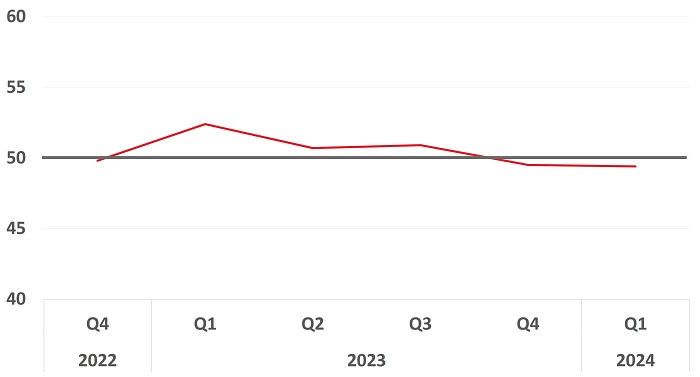
Find out more about how the education industry performed in the OCBC SME Index each quarter.
Education registered at 49.6, dropping into contractionary territory in 2Q 2026. Growth in Early Childhood Education (51.8) was outweighed by the contractions in Training Centres (48.4) and Formal Education & Commercial Schools (49.5).
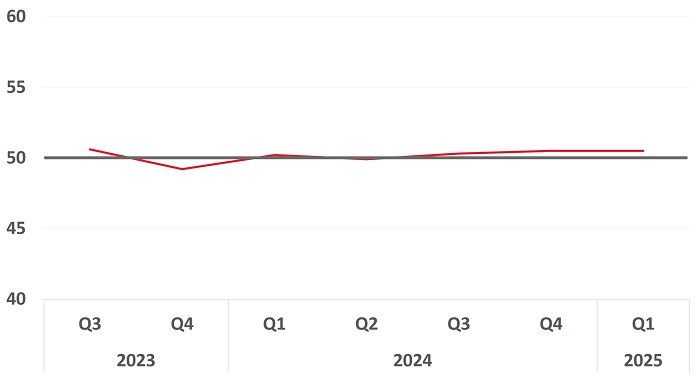
Find out more about how the education industry performed in the OCBC SME Index each quarter.
Education registered at 49.6, dropping into contractionary territory in 2Q 2026. Growth in Early Childhood Education (51.8) was outweighed by the contractions in Training Centres (48.4) and Formal Education & Commercial Schools (49.5).
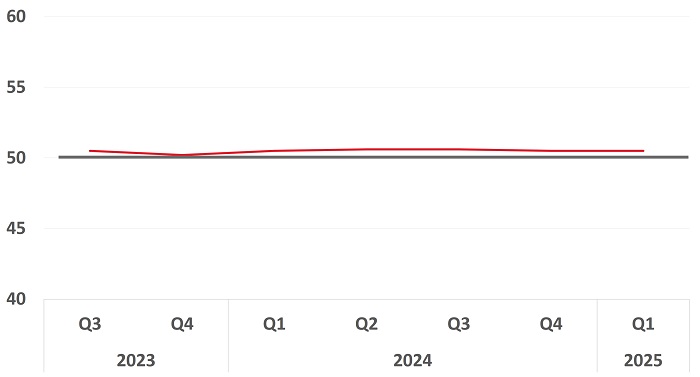
Find out more about how the education industry performed in the OCBC SME Index each quarter.
Education registered at 49.6, dropping into contractionary territory in 2Q 2026. Growth in Early Childhood Education (51.8) was outweighed by the contractions in Training Centres (48.4) and Formal Education & Commercial Schools (49.5).
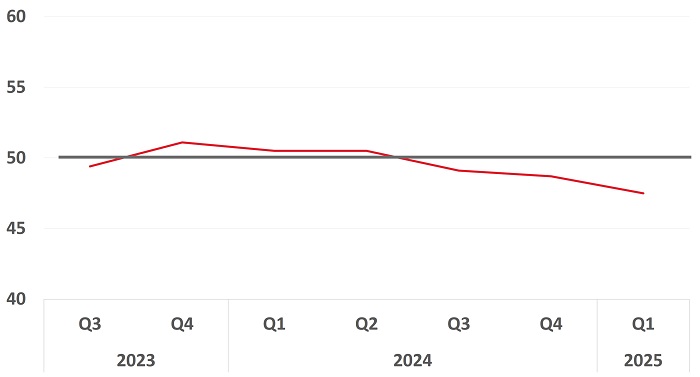
Education registered at 49.6, dropping into contractionary territory in 2Q 2026. Growth in Early Childhood Education (51.8) was outweighed by the contractions in Training Centres (48.4) and Formal Education & Commercial Schools (49.5).
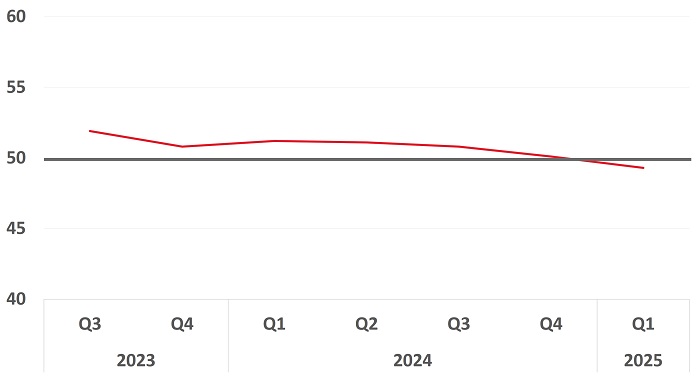
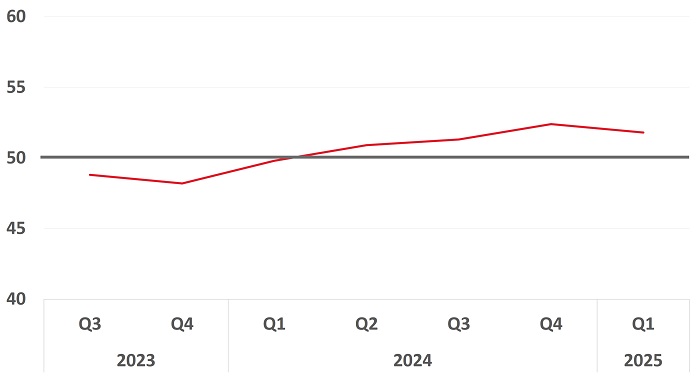
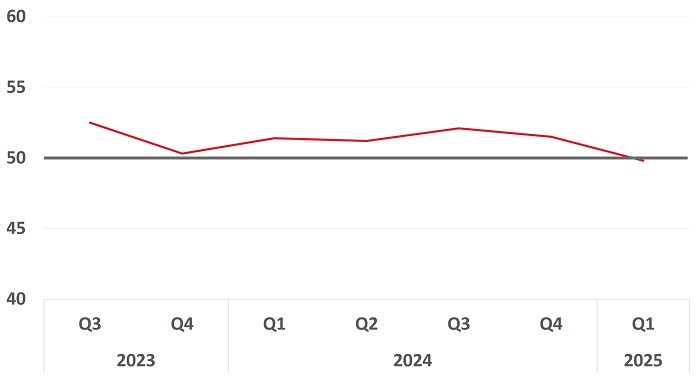
F&B moderated to 50.3 in 2Q 2026, down from the 51.1 recorded last quarter. Growth was primarily driven by the F&B Wholesale Trade segment (50.7). Overall collections and payments grew year-on-year by 8.9% and 7.7%, respectively. SMEs in the industry experienced stronger business activity in June, supported by increased demand across the retail, services and wholesale trade segments compared to earlier months in the quarter.
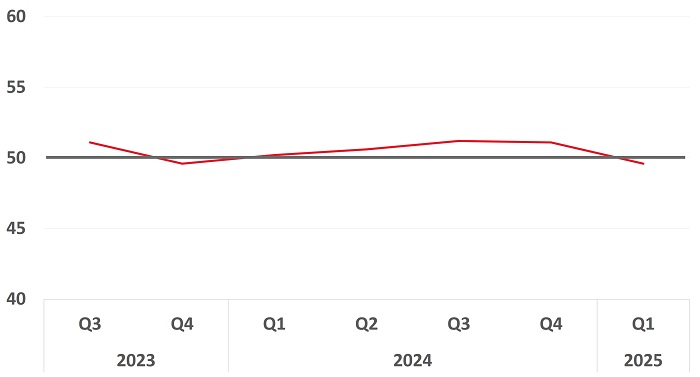
Find out more about how the F&B industry performed in the OCBC SME Index each quarter.
F&B moderated to 50.3 in 2Q 2026, down from the 51.1 recorded last quarter. Growth was primarily driven by the F&B Wholesale Trade segment (50.7). Overall collections and payments grew year-on-year by 8.9% and 7.7%, respectively. SMEs in the industry experienced stronger business activity in June, supported by increased demand across the retail, services and wholesale trade segments compared to earlier months in the quarter.
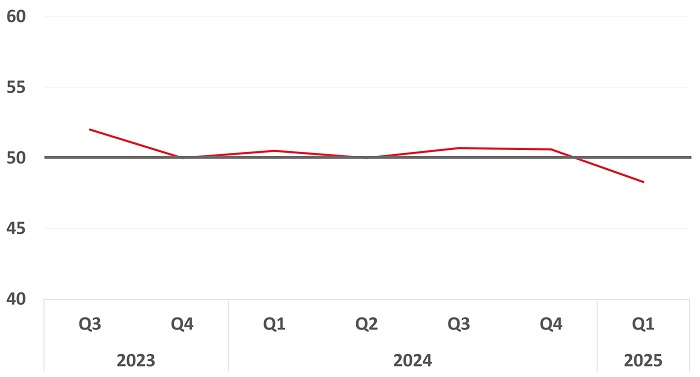
Find out more about how the F&B industry performed in the OCBC SME Index each quarter.
F&B moderated to 50.3 in 2Q 2026, down from the 51.1 recorded last quarter. Growth was primarily driven by the F&B Wholesale Trade segment (50.7). Overall collections and payments grew year-on-year by 8.9% and 7.7%, respectively. SMEs in the industry experienced stronger business activity in June, supported by increased demand across the retail, services and wholesale trade segments compared to earlier months in the quarter.
Find out more about how the F&B industry performed in the OCBC SME Index each quarter.
F&B moderated to 50.3 in 2Q 2026, down from the 51.1 recorded last quarter. Growth was primarily driven by the F&B Wholesale Trade segment (50.7). Overall collections and payments grew year-on-year by 8.9% and 7.7%, respectively. SMEs in the industry experienced stronger business activity in June, supported by increased demand across the retail, services and wholesale trade segments compared to earlier months in the quarter.
Find out more about how the F&B industry performed in the OCBC SME Index each quarter.
F&B moderated to 50.3 in 2Q 2026, down from the 51.1 recorded last quarter. Growth was primarily driven by the F&B Wholesale Trade segment (50.7). Overall collections and payments grew year-on-year by 8.9% and 7.7%, respectively. SMEs in the industry experienced stronger business activity in June, supported by increased demand across the retail, services and wholesale trade segments compared to earlier months in the quarter.
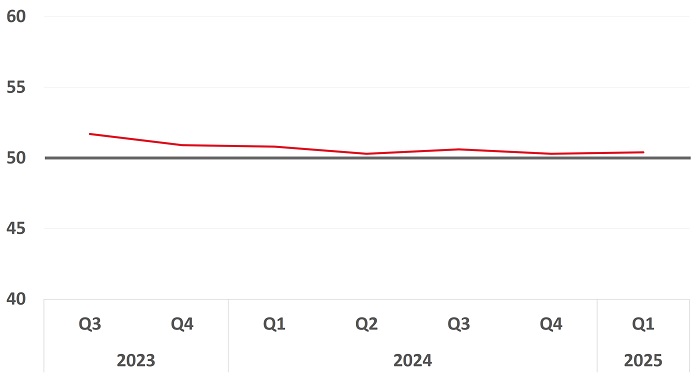
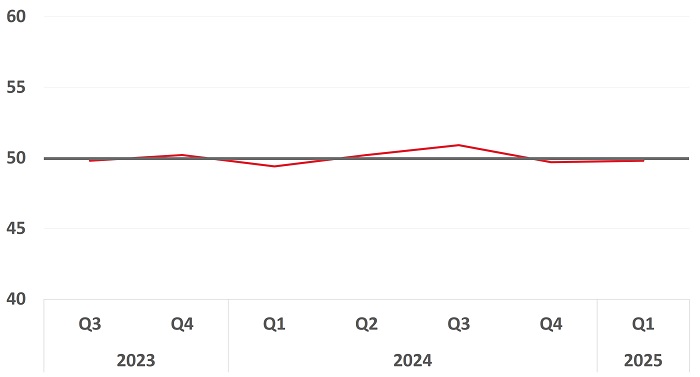
Healthcare registered an expansion of 50.1 in 2Q 2026 and saw a slowdown in the pace of growth from the previous quarter. Strong performance in the Healthcare Distributor segment (51.9) was partially offset by contraction in the Healthcare Provider segment (49.4). While overall collections increased by 7.3% year-on-year, payments grew at a faster pace of 12.4%. The strong growth in payments could suggest that cost pressures may be outpacing revenue growth for Healthcare SMEs.
Find out more about how the healthcare industry performed in the OCBC SME Index each quarter.
Healthcare registered an expansion of 50.1 in 2Q 2026 and saw a slowdown in the pace of growth from the previous quarter. Strong performance in the Healthcare Distributor segment (51.9) was partially offset by contraction in the Healthcare Provider segment (49.4). While overall collections increased by 7.3% year-on-year, payments grew at a faster pace of 12.4%. The strong growth in payments could suggest that cost pressures may be outpacing revenue growth for Healthcare SMEs.
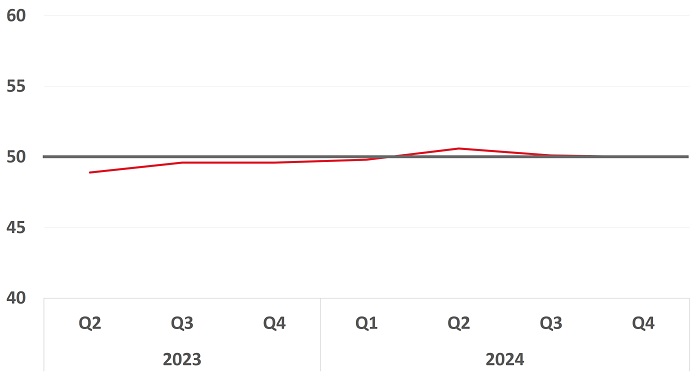
Find out more about how the healthcare industry performed in the OCBC SME Index each quarter.
Healthcare registered an expansion of 50.1 in 2Q 2026 and saw a slowdown in the pace of growth from the previous quarter. Strong performance in the Healthcare Distributor segment (51.9) was partially offset by contraction in the Healthcare Provider segment (49.4). While overall collections increased by 7.3% year-on-year, payments grew at a faster pace of 12.4%. The strong growth in payments could suggest that cost pressures may be outpacing revenue growth for Healthcare SMEs.
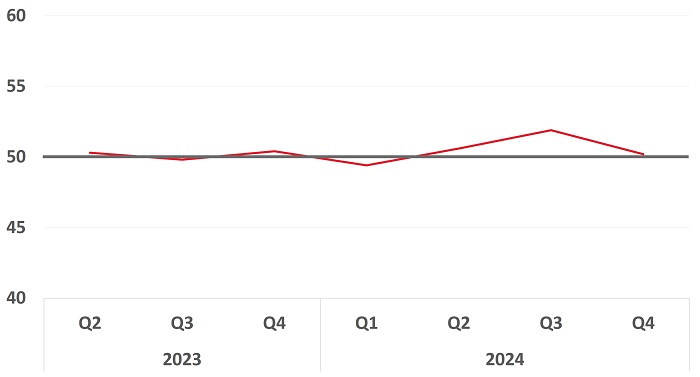
Find out more about how the healthcare industry performed in the OCBC SME Index each quarter.
Healthcare registered an expansion of 50.1 in 2Q 2026 and saw a slowdown in the pace of growth from the previous quarter. Strong performance in the Healthcare Distributor segment (51.9) was partially offset by contraction in the Healthcare Provider segment (49.4). While overall collections increased by 7.3% year-on-year, payments grew at a faster pace of 12.4%. The strong growth in payments could suggest that cost pressures may be outpacing revenue growth for Healthcare SMEs.
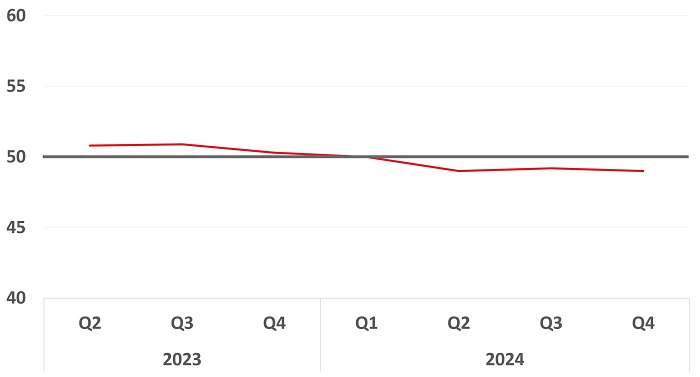
ICT
ICT eased to 51.1 in 2Q 2026 but remained in expansionary territory for the fourth consecutive quarter. Growth this quarter was driven by expansions in IT Consultancy (50.4) and Manufacturing & Sales (51.9). Increased spending on technology and the growing adoption of AI and automation has created opportunities for SMEs in the industry, supporting demand for digital infrastructure and ICT services.
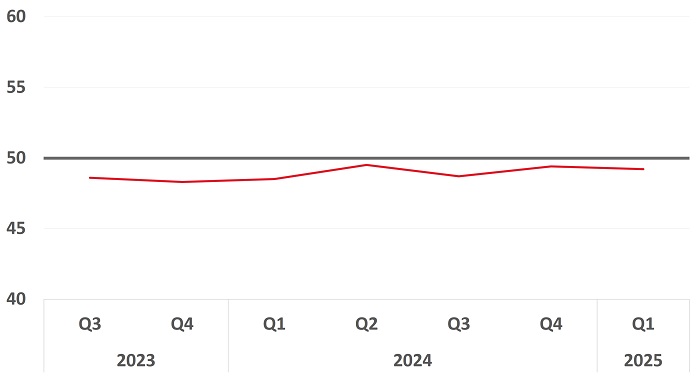
ICT eased to 51.1 in 2Q 2026 but remained in expansionary territory for the fourth consecutive quarter. Growth this quarter was driven by expansions in IT Consultancy (50.4) and Manufacturing & Sales (51.9). Increased spending on technology and the growing adoption of AI and automation has created opportunities for SMEs in the industry, supporting demand for digital infrastructure and ICT services.
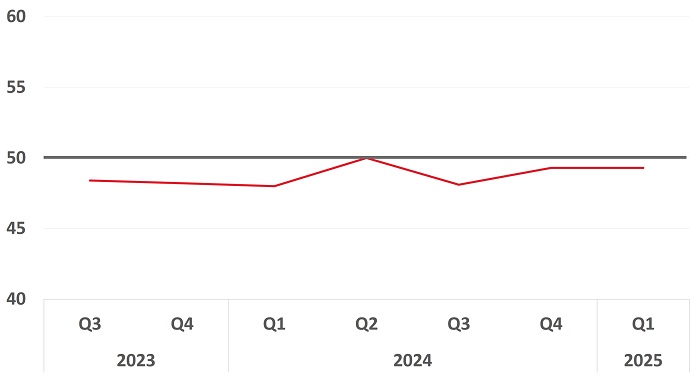
ICT eased to 51.1 in 2Q 2026 but remained in expansionary territory for the fourth consecutive quarter. Growth this quarter was driven by expansions in IT Consultancy (50.4) and Manufacturing & Sales (51.9). Increased spending on technology and the growing adoption of AI and automation has created opportunities for SMEs in the industry, supporting demand for digital infrastructure and ICT services.
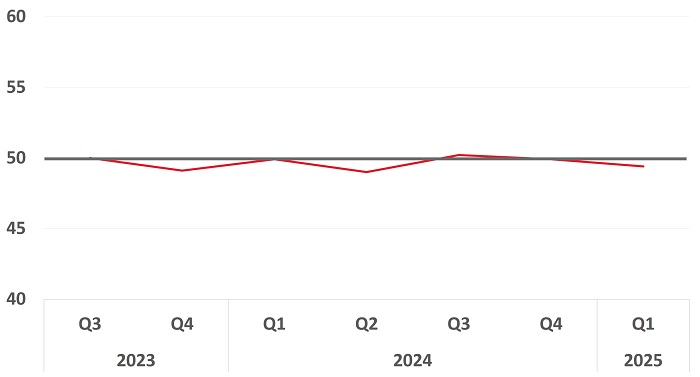
ICT eased to 51.1 in 2Q 2026 but remained in expansionary territory for the fourth consecutive quarter. Growth this quarter was driven by expansions in IT Consultancy (50.4) and Manufacturing & Sales (51.9). Increased spending on technology and the growing adoption of AI and automation has created opportunities for SMEs in the industry, supporting demand for digital infrastructure and ICT services.
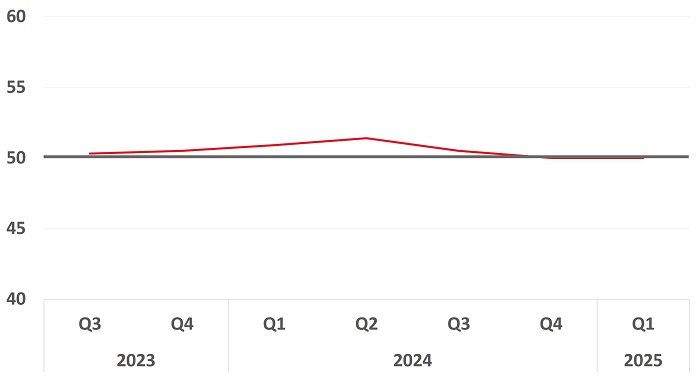
ICT eased to 51.1 in 2Q 2026 but remained in expansionary territory for the fourth consecutive quarter. Growth this quarter was driven by expansions in IT Consultancy (50.4) and Manufacturing & Sales (51.9). Increased spending on technology and the growing adoption of AI and automation has created opportunities for SMEs in the industry, supporting demand for digital infrastructure and ICT services.
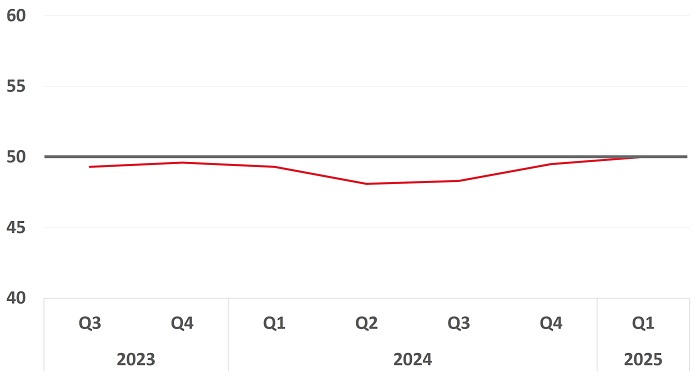
ICT eased to 51.1 in 2Q 2026 but remained in expansionary territory for the fourth consecutive quarter. Growth this quarter was driven by expansions in IT Consultancy (50.4) and Manufacturing & Sales (51.9). Increased spending on technology and the growing adoption of AI and automation has created opportunities for SMEs in the industry, supporting demand for digital infrastructure and ICT services.
Manufacturing
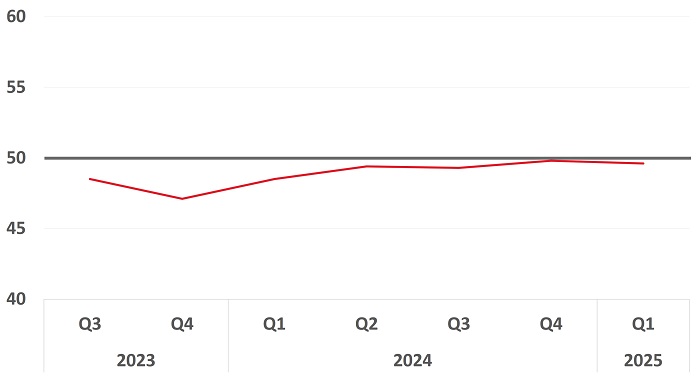
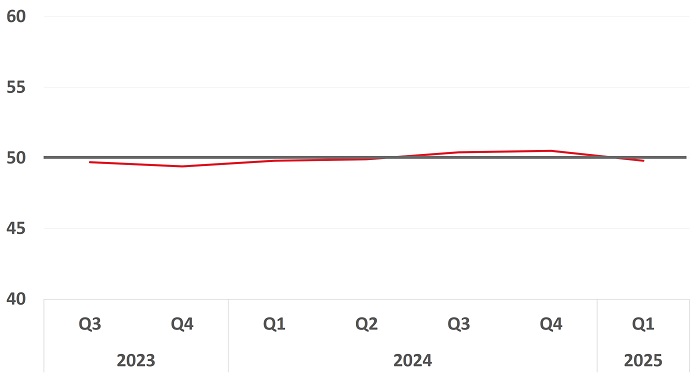
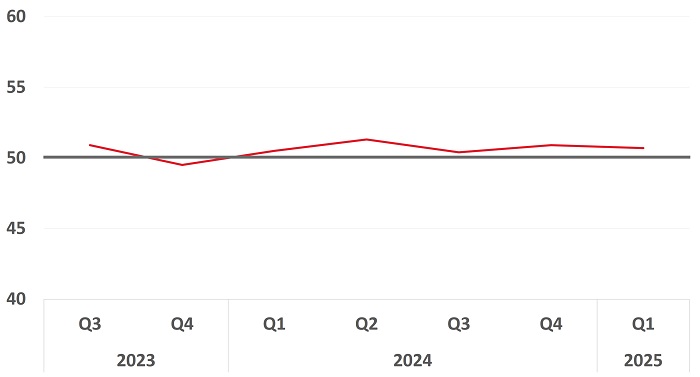
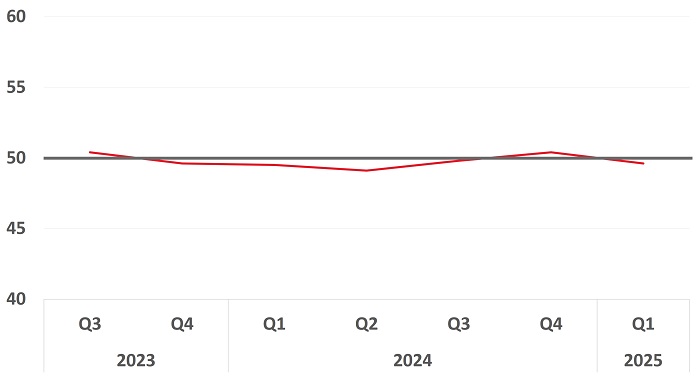
Manufacturing extended its upward trajectory in 2Q 2026 and registered at 52.1 in 2Q 2026. This was accompanied by a 14.5% increase in collections and 11.5% increase in payments on a year-on-year basis. Strong performance of the sector is primarily attributed to the Precision Engineering (53.1) segment. SMEs in the Consumer Products and Electronics & Semiconductors segments also both registered a robust reading of 50.7.
SMEs in industry are likely benefiting from the ongoing demand for AI related hardware and advanced electronics manufacturing equipment, which has supported business activity.
Manufacturing extended its upward trajectory in 2Q 2026 and registered at 52.1 in 2Q 2026. This was accompanied by a 14.5% increase in collections and 11.5% increase in payments on a year-on-year basis. Strong performance of the sector is primarily attributed to the Precision Engineering (53.1) segment. SMEs in the Consumer Products and Electronics & Semiconductors segments also both registered a robust reading of 50.7.
SMEs in industry are likely benefiting from the ongoing demand for AI related hardware and advanced electronics manufacturing equipment, which has supported business activity.

Manufacturing extended its upward trajectory in 2Q 2026 and registered at 52.1 in 2Q 2026. This was accompanied by a 14.5% increase in collections and 11.5% increase in payments on a year-on-year basis. Strong performance of the sector is primarily attributed to the Precision Engineering (53.1) segment. SMEs in the Consumer Products and Electronics & Semiconductors segments also both registered a robust reading of 50.7.
SMEs in industry are likely benefiting from the ongoing demand for AI related hardware and advanced electronics manufacturing equipment, which has supported business activity.
Manufacturing extended its upward trajectory in 2Q 2026 and registered at 52.1 in 2Q 2026. This was accompanied by a 14.5% increase in collections and 11.5% increase in payments on a year-on-year basis. Strong performance of the sector is primarily attributed to the Precision Engineering (53.1) segment. SMEs in the Consumer Products and Electronics & Semiconductors segments also both registered a robust reading of 50.7.
SMEs in industry are likely benefiting from the ongoing demand for AI related hardware and advanced electronics manufacturing equipment, which has supported business activity.
Manufacturing extended its upward trajectory in 2Q 2026 and registered at 52.1 in 2Q 2026. This was accompanied by a 14.5% increase in collections and 11.5% increase in payments on a year-on-year basis. Strong performance of the sector is primarily attributed to the Precision Engineering (53.1) segment. SMEs in the Consumer Products and Electronics & Semiconductors segments also both registered a robust reading of 50.7.
SMEs in industry are likely benefiting from the ongoing demand for AI related hardware and advanced electronics manufacturing equipment, which has supported business activity.
Transport & Logistics
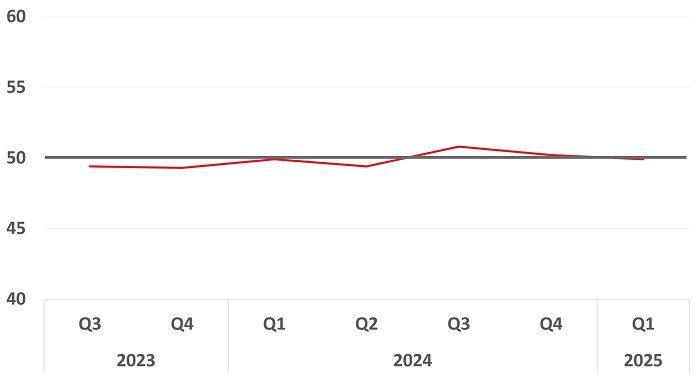
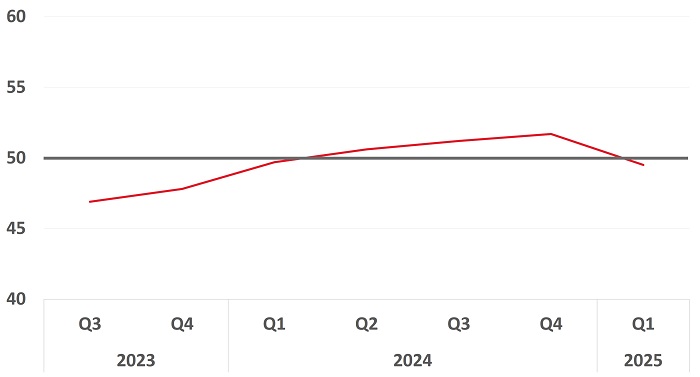
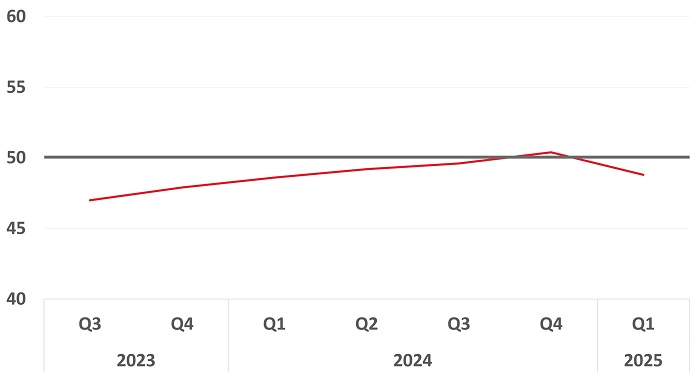
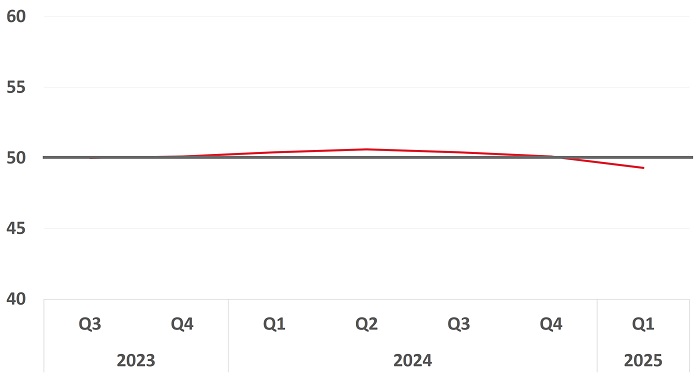
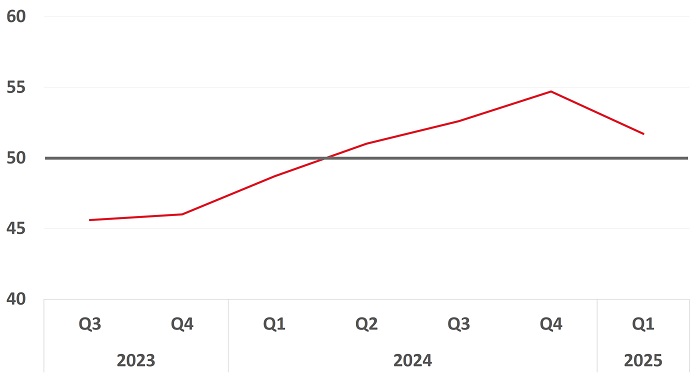
Transport & Logistics registered its third consecutive quarter of expansion with a reading of 51.5 in 2Q 2026. Overall collections and payments rose by 15.4% year-on-year and 14.4% year-on-year respectively, as SMEs in the sector benefitted from increased trade activity. Growth in the sector was supported by expansions in Sea Transport (50.9), Land Transport (50.9) and Logistics (51.5).
Find out more about how the Transport & Logistics industry performed in the OCBC SME Index each quarter.
Transport & Logistics registered its third consecutive quarter of expansion with a reading of 51.5 in 2Q 2026. Overall collections and payments rose by 15.4% year-on-year and 14.4% year-on-year respectively, as SMEs in the sector benefitted from increased trade activity. Growth in the sector was supported by expansions in Sea Transport (50.9), Land Transport (50.9) and Logistics (51.5).
Find out more about how the Transport & Logistics industry performed in the OCBC SME Index each quarter.
Transport & Logistics registered its third consecutive quarter of expansion with a reading of 51.5 in 2Q 2026. Overall collections and payments rose by 15.4% year-on-year and 14.4% year-on-year respectively, as SMEs in the sector benefitted from increased trade activity. Growth in the sector was supported by expansions in Sea Transport (50.9), Land Transport (50.9) and Logistics (51.5).
Find out more about how the Transport & Logistics industry performed in the OCBC SME Index each quarter.
Transport & Logistics registered its third consecutive quarter of expansion with a reading of 51.5 in 2Q 2026. Overall collections and payments rose by 15.4% year-on-year and 14.4% year-on-year respectively, as SMEs in the sector benefitted from increased trade activity. Growth in the sector was supported by expansions in Sea Transport (50.9), Land Transport (50.9) and Logistics (51.5).
Find out more about how the Transport & Logistics industry performed in the OCBC SME Index each quarter.
Transport & Logistics registered its third consecutive quarter of expansion with a reading of 51.5 in 2Q 2026. Overall collections and payments rose by 15.4% year-on-year and 14.4% year-on-year respectively, as SMEs in the sector benefitted from increased trade activity. Growth in the sector was supported by expansions in Sea Transport (50.9), Land Transport (50.9) and Logistics (51.5).
Wholesale Trade
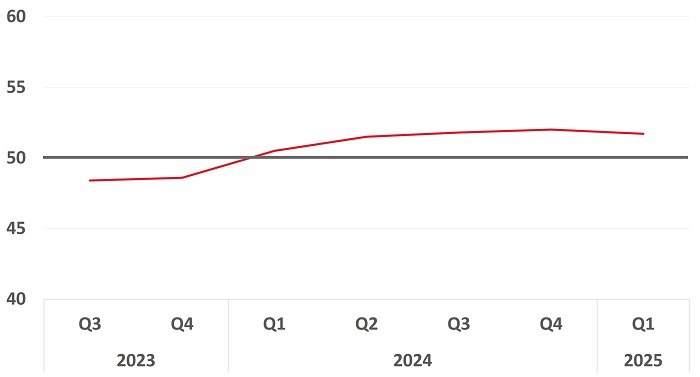
Wholesale Trade registered at 51.7 in 2Q 2026, extending its expansionary run by another quarter. Overall collections grew by 18.4% year-on-year, while overall payments grew by 17.9% year-on-year.
Retail
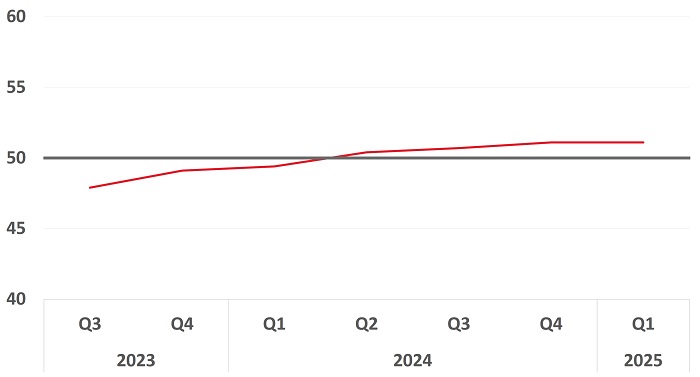
Retail moderated from the peak last quarter to 52.8 in 2Q 2026. This was accompanied by a year-on-year increase in overall collections and payments of 17.2% and 17.5% respectively. In the second quarter, SMEs in the Retail sector were supported by healthy consumer spending, underpinned by a resilient domestic labor market.
Resources
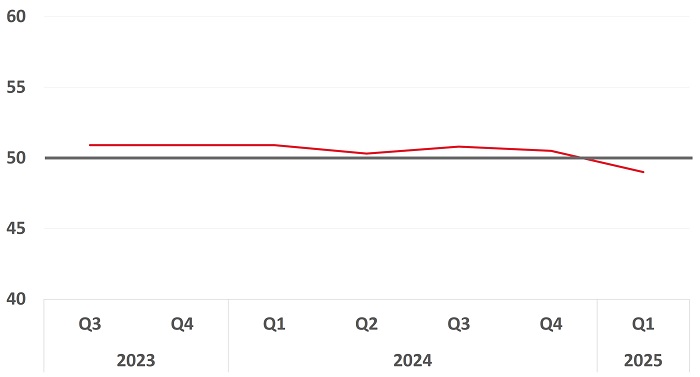
Resources continues to remain in the expansion territory at 50.8 in 2Q 2026. The pace of growth has picked up from the previous quarter. Overall collections and payments saw a 21.6% and 20.8% year-on-year growth, respectively.
OCBC Research insights

Download past reports
2026
2025
2024
2023
2022
Or WhatsApp / SMS us at +65 8138 1964
F&B
4Q 24
F&B continues to be expansionary at 51.1 this quarter. Collections and payments for the industry increased by 7.6% and 7.2% respectively on a year-on-year basis.
1Q 25
Food & Beverage softened to 49.6 this quarter, a sizeable decline from the 51.1 registered in 4Q 2024.
2Q 25
F&B expanded to 50.6 in 2Q 2025, marking a rise in reading from the 49.6 recorded last quarter. Collections grew by 4.2% on-year, while payments grew by 5.0% on-year.
3Q 25
F&B moderated to 49.4 this quarter, reversing last quarter's expansionary results. Collections grew by 3.5% on-year, while payments improved slightly by 0.6% on-year.
4Q 25
Food & Beverages (F&B) was neutral with a reading of 50.0, improving slightly from the last quarter.
1Q 26
F&B registered an expansion of 51.1 in 1Q 2026 buoyed by growth across all segments. Overall collections and payments grew by 7.6% and 6.2% respectively.
2Q 26
F&B registered an expansion of 50.3 in 2Q 2026, moderating from last quarter's result. This was accompanied with a 8.9% on-year increase in collections and a 7.7% on-year increase in payments.
F&B Services
4Q 24
F&B Services eased slightly to 50.6 this quarter, with a 5.1% rise in collections and 6.7% rise in payments on a year-on-year basis.
1Q 25
F&B Services fell into contraction at 48.3 this quarter. Collections and payments fell by 1.7% on-year and 0.9% on-year respectively.
2Q 25
F&B Services turned expansionary this quarter, registering a reading of 50.3. This was accompanied by a 3.4% on-year increase in collections and 2.6% on-year increase in payments.
3Q 25
F&B Services reversed it's expansionary results from last quarter to register a contraction at 49.0. Collections declined by 2.0% on-year and payments dropped by 3.6% on-year.
4Q 25
F&B Services saw improvement in performance but remained in contraction for another quarter and registered at 49.9.
1Q 26
F&B Services reversed it's contractionary results from the last quarter to register an expansion at 51.2.
2Q 26
F&B Services registered an expansion at 50.1, remaining in the expansionary territory while moderating slightly from last quarter's reading of 51.2.
F&B Wholesale Trade
4Q 24
F&B Wholesale Trade continues on an upward trajectory over the quarter, with an improvement in reading from 51.3 last quarter to 52.4 in 4Q 2024. Collections and payments grew at 15.7% and 11.2% on-year respectively.
1Q 25
F&B Wholesale Trade grew at a healthy pace with a reading of 51.8 this quarter. This expansion is accompanied by a 17.4% increase in collections and a 17.6% increase in payments year-on-year.
2Q 25
F&B Wholesale Trade grew at a healthy pace with a reading of 51.7 this quarter, with SMEs in the segment driving overall growth in the F&B industry.
3Q 25
F&B Wholesale Trade moderated but remained in expansion and registered a reading of 50.7 this quarter. The segment saw a 6.4% on-year growth in collections and a 7.2% on-year growth in payments.
4Q 25
F&B Wholesale Trade Trade moved into the contraction territory at 49.8, a drop from last quarter's reading of 50.7.
1Q 26
F&B Wholesale Trade saw improvement in performance and registered an expansion at 50.4.
2Q 26
F&B Wholesale Trade remained in expansion and registered at 50.7, improving by 0.3 from the previous quarter. Collections and payments grew by 16.8% and 17.4% year-on-year, respectively.
F&B Retail
4Q 24
F&B Retail moderated slightly to 51.5 this quarter, with a 3.5% on-year increase in collections and 5.6% on-year increase in payments.
1Q 25
F&B Retail contracted at 49.8 this quarter. Collections and payments fell by 2.2% and 0.8% respectively on an on-year basis.
2Q 25
F&B Retail flat lined at 49.9 this quarter, improving marginally by 0.1 from the previous quarter.
3Q 25
F&B Retail moved further into contraction at 48.4 this quarter. This is the segment's third consecutive month of contraction.
4Q 25
F&B Retail remained in contraction this quarter with a reading of 49.2. This is the segment's fourth consecutive month of contraction.
1Q 26
F&B Retail reversed last quarter's contractionary results after four quarters of contraction and expanded at 50.6 in 1Q 2026.
2Q 26
F&B Retail dropped into the contractionary territory and registered at 49.7 in 2Q 2026.
Healthcare
4Q 24
Healthcare contracted at 49.7 in Q4 2024, down from the 50.9 registered last quarter. Both the Healthcare Distributor and Healthcare Provider segments experienced a drop in their readings. Collections and payments in the industry grew minimally at 0.5% and 0.6% on-year respectively.
1Q 25
Healthcare flat lined at 49.8 this quarter and stayed in contraction, even as collections and payments rose by 3.8% and 4.0% on-year respectively.
2Q 25
Healthcare grew to 50.3 in 2Q 2025 after two consecutive quarters in contraction, with overall growth supported by the Healthcare Providers segment.
3Q 25
Healthcare eased to 50.1 this quarter, maintaining the industry's expansionary results for the second consecutive quarter this year.
4Q 25
Healthcare registered a contraction at 49.7 this quarter, a drop from last quarter's reading of 50.1.
1Q 26
Healthcare registered an expansion at 50.7 in 1Q 2026, recovering from the contraction in the previous quarter. Overall collections grew by 6.4% year-on-year, outpaced by the growth in payments of 9.5%.
2Q 26
Healthcare moderated but remained in expansion and registered a reading of 50.1 this quarter. Overall collections and payments grew by 7.3% and 12.4% year-on-year, respectively.
Healthcare Distributor
4Q 24
Healthcare Distributors edged lower to 50.0 this quarter, down from the 50.1 registered in 3Q 2024.
1Q 25
Healthcare Distributors contracted at 48.9 this quarter, with SMEs in the segment registering a 5.8% decline in collections.
2Q 25
Healthcare Distributors contracted for the third consecutive quarter at 49.1, with SMEs in the segment registering a 0.7% on-year decline in collections and 12.8% on-year decline in payments.
3Q 25
Healthcare Distributors reversed it's contractionary results of the last quarter and registered an expansion at 50.2. Collections grew by 7.8% on-year and payments grew by 9.6% on-year.
4Q 25
The Healthcare Distributor segment registered at 49.7 and moved into the contraction territory this quarter.
1Q 26
The Healthcare Distributor segment registered a strong expansion at 52.2. Collections and payments for the segment saw year-on-year growth of 18.3% and 19.8%, respectively.
2Q 26
Healthcare Distributors registered another quarter of expansion at 51.9. This was accompanied with a 16.7% on-year increase in collections and a 30.6% on-year increase in payments.
Healthcare Provider
4Q 24
Reading of Healthcare Providers dropped from 51.9 in 3Q to 50.2 in 4Q, as SMEs in the segment saw a 8.6% increase in collections and 4.5% increase in payments.
1Q 25
Healthcare Providers remained in expansion at 50.5, improving marginally from the 50.2 registered last quarter. Collections and payments recorded an increase of 3.9% and 5.8% respectively, on a year-on-year basis.
2Q 25
Healthcare Providers remained in expansion for the fifth consecutive quarter at 50.9, improving from the 50.5 registered last quarter.
3Q 25
Healthcare Providers moved into contraction at 49.6 in 3Q 2025, ending the segments expansionary run over the last 5 quarters.
4Q 25
The Healthcare Provider segment remained in contraction for another quarter at 49.8.
1Q 26
The Healthcare Provider segment reversed last month's contraction and registered an expansion at 50.3.
2Q 26
Healthcare Providers dropped into contraction and registered at 49.4 in 2Q 2026.
Transport & Logistics
4Q 24
Transport & Logistics continues on an upward trajectory and rose to 51.7, up from the 51.2 registered last quarter. All key segments showed growth this quarter, with the Logistics segment coming in strongly at 54.7.
1Q 25
Transport & Logistics deteriorated to 49.5 in 1Q 2025, down from the 51.7 registered last quarter. This was accompanied by a 0.9% on-year increase in collections and 0.8% on-year drop in payments.
2Q 25
Transport & Logistics edged higher to 49.8 in 2Q 2025, with growth mainly supported by healthy performance in the Logistics segment.
3Q 25
Transport & Logistics remained in contraction but improved marginally to 49.9. Collections grew by 6.7% on-year, while payments grew by 1.9% on-year.
4Q 25
Transport & Logistics registered an expansion at 50.1. This was accompanied by an increase in overall collections and payments of 8% on-year and 10% on-year, respectively.
1Q 26
Transport & Logistics grew to 51.2 in 1Q 2026, up from the 50.1 recorded in last quarter. Collections and payments for the sector grew by 14.1% and 16.1% respectively on a year-on-year basis.
2Q 26
Transport & Logistics registered another quarter of expansion at 51.5 in 2Q 2026. Overall collections and payments grew by 15.4% and 14.4% year-on-year, respectively.
Sea Transport
4Q 24
The Sea Transport segment expanded at 50.4 in 4Q, an increase from the 49.6 registered last quarter. Collections and payments however, declined at 8.9% and 17.1% on-year respectively.
1Q 25
Sea Transport fell into contraction at 48.8 this quarter. This reversal from expansion is accompanied by a 15.1% on-year drop and a 16.8% on-year decline in Collections and Payments respectively.
2Q 25
The contraction in Sea Transport narrowed to 49.7, as SMEs in the segment saw an improvement in reading from the 48.8 recorded last quarter.
3Q 25
Sea Transport remained in contraction and registered at 49.9, a slight improvement from last quarter's results.
4Q 25
Sea Transport registered a reading of 49.8, remaining in contraction for the fourth consecutive quarter.
1Q 26
Sea Transport improved and registered an expansion at 51.1, ending the segment's contractionary run over the last four quarters.
2Q 26
Sea Transport registered a reading of 50.9 in 2Q 2026, remaining in expansionary territory. Collections saw a 17.5% on-year growth and payments saw a 12.1% on-year growth in this quarter.
Land Transport
4Q 24
Land Transport eased slightly to 50.1 this quarter. Collections and payments increased at 3.6% and 2.2% on-year respectively.
1Q 25
Land Transport contracted at 49.3 this quarter. Down from the 50.1 registered in 4Q 2024.
2Q 25
Land Transport improved to 49.7 this quarter, but remained in contractionary territory.
3Q 25
Land Transport remained in contraction and registered at 49.9.
4Q 25
Land Transport reversed from the contraction territory and expanded at 50.6 this quarter. This is accompanied with a 9% year-on-year increase in payments, and a 10% year-on-year increase in payments.
1Q 26
Land Transport improved and registered an expansion at 51.0. This is accompanied with a 10.3% year-on-year increase in collections and a 11.9% year-on-year increase in payments.
2Q 26
Land Transport registered a reading of 50.9 in 2Q 2026, remaining in expansionary territory. Collections grew by 13.5% and payments grew by 15.1% year-on-year, respectively.
Logistics
4Q 24
Logistics expanded at 54.7 this quarter, benefitting from strong external demand and robust construction and manufacturing activity over the quarter. Collections and payments increased substantially at 42.8% and 33.6% on-year respectively.
1Q 25
Logistics moderated but remained in expansion at 51.7 this quarter. This strong performance is led by a healthy 20.8% growth in Collections and a 16.8% growth in Payments on an on-year basis.
2Q 25
Reading in the Logistics segment moderated to 50.8, down from the 51.7 last quarter. SMEs in the segment remained in expansion as collections and payments grew by 9.3% and 12.6% year-on-year respectively.
3Q 25
Logistics fell into contraction at 49.4 this quarter, down from last quarter's expansionary results.
4Q 25
The Logistics segment registered a reading of 48.6, a drop from last quarters reading of 49.4. This is the segment's second consecutive quarter of contraction.
1Q 26
Logistics improved and registered an expansion at 50.4 in 1Q 2026, an improvement from last quarter's contractionary results.
2Q 26
Logistics edged higher from the previous quarter to register an expansion at 51.1 in 2Q 2026. Both collections and payments saw a 19.2% on-year growth each.
Education
4Q 24
Expansion in the Education industry moderated to 50.0 in 4Q 2024. Collections and payments grew by 7.4% and 9.9% on-year respectively.
1Q 25
Education dipped to 49.6 in 1Q 2025 and fell into the contraction territory. This was led by a 3.0% increase in collections and 2.0% fall in payments.
2Q 25
Education remained in contraction for the second consecutive quarter at 49.7. This was led by a 1.1% on-year drop in collections and 1.8% on-year drop in payments.
3Q 25
Education remained in contraction for the third consecutive quarter at 49.9. This was led by a 1.1% on-year drop in payments, and a marginal 2.3% on-year increase in collections.
4Q 25
Education improved to 50.3 in 4Q25, entering the expansion territory with a 4% year-on-year increase in collections and a 1% year-on-year increase in payments.
1Q 26
Education improved to 50.6 in 1Q 2026, with a steady year-on-year increase in overall collections and payments at 5.2% and 4.8% respectively.
2Q 26
Education registered at 49.6, dropping into contractionary territory in 2Q 2026.
Education - Early Childhood Education
4Q 24
Early Childhood Education fell into contraction at 49.4, down from the 50.0 registered in 3Q 2024. This contraction comes even as the segment saw healthy collections and payments growth at 10.8% on-year and 9.1% on-year respectively.
1Q 25
Early Chilldhood Education saw a modest expansion of 50.2, up from the 49.4 registered last quarter. Collections and payments saw health growth at 15.5% and 14.3% on-year respectively.
2Q 25
Early Childhood Education fell to 49.3 in 2Q 2025, down from the 50.2 registered last quarter.
3Q 25
Early Childhood Education maintained at 49.3 in 3Q 2025. Collections maintained a 2.3% on-year growth, while payments registered a 5.5% on-year decline this quarter.
4Q 25
Early Childhood Education expanded to 50.6, an improvement from the 49.3 registered last quarter.
1Q 26
Early Childhood Education remained in expansion with a reading of 50.4. The pace of growth has slowed from the last quarter.
2Q 26
Early Childhood Education remained in expansion with a reading of 51.8.
Education - Training Centres
4Q 24
Training Centres improved to 50.5 this quarter, as collections and payments rose by 12.0% on-year and 11.1% on-year respectively.
1Q 25
Training Centres maintained at 50.5, registering another quarter of expansion.
2Q 25
Training Centres maintained at 50.6, registering another quarter of expansion.
3Q 25
Training Centres improved to 50.9 this quarter, registering another quarter of expansion.
4Q 25
Training Centres eased marginally and remains in expansion at 50.8. Business activity is likely driven by individuals utilising their Skills Future credits ahead of the end-2025 expiry.
1Q 26
Training Centres registered an expansion at 50.9 in 1Q 2026, a marginal improvement from last quarter's reading of 50.8.
2Q 26
Training Centres moved into the contraction territory by registering at 48.4 in 2Q 2026. This was accompanied with a 3.4% on-year drop in collections and 9.7% on-year drop in payments.
Education - Recreation Classes
4Q 24
Recreation classes moderated in growth, with a dip in reading to 50.5 this quarter.
1Q 25
Recreation Classes maintained at 50.5, registering another quarter of expansion. Collections and Payments increased by 8.3% and 3.8% on-year respectively.
2Q 25
Recreation Classes recorded another quarter of modest expansion with a reading of 50.8. Collections and Payments increased by 11.3% and 5.2% on-year respectively.
3Q 25
Recreation Classes recorded another quarter of expansion, bringing the reading to 50.5.
4Q 25
Recreation Classes recorded another quarter of expansion at 50.1, easing marginally from last quarter's reading of 50.5.
1Q 26
Recreation Classes recorded another quarter of expansion at 50.5, an improvement from the 50.1 registered last quarter.
2Q 26
Recreation Classes remained in the neutral territory of 50.0.