Evolving energy transition, evolving opportunities
Evolving energy transition, evolving opportunities
The crosscurrents shaping the low-carbon transition favour an active investment approach – including allocations to both public and private markets.
Summary
- In June 2023, we laid out our view of how we thought the low-carbon transition was most likely to unfold – and what it means for investors. We now revisit that outlook.
- We take stock of key developments since 2023, including the impact of colliding mega forces, intensifying public subsidies and shifting policies. And we examine how the intersection of evolving industrial, trade and energy policies with rapid technological change may alter the transition path and investment opportunities from here.
- Global power demand is soaring, according to the International Energy Agency, driven by factors including the proliferation of power-hungry AI data centres, especially in the US, and building cooling needs in emerging markets. This trend has created investment opportunities across the energy value chain. US utility stocks, particularly nuclear-heavy providers, have rallied, while renewable energy production has surged by 70% since 2019, data from Bloomberg and the Energy Institute show. Yet the continued growth of coal, oil and gas use shows clean energy is helping to meet new demand rather than substituting traditional energy.
- Strategic competition in the energy system is entering a new era, in our view: It is no longer confined to hydrocarbons, as global competition in AI and low-carbon technologies intensifies. A resurgence of industrial and trade policies supporting domestic companies has led to economic distortions, like an oversupply of batteries, solar cells and electric vehicles (EVs). Lower prices, driven by these policies, are spurring adoption but eroding profitability except in shielded markets like the US solar sector. These approaches are set to drive greater return dispersion.
- Election outcomes in 2024 are triggering further shifts in energy, industrial and trade policies. Policymakers are seeking to balance energy security, decarbonisation, resilience and affordability with economic competitiveness. Most 2024 elections have signalled policy continuity, yet key nations could see domestic changes with global ripple effects.
- In the near term, we believe these developments will limit the speed at which low-carbon energy grows its share of the global energy mix. Both traditional and low-carbon energy supply will likely grow to match demand. Market impacts are already visible. Clean energy stocks have underperformed over the past two years despite surging investment and use. Higher interest rates and supply chain issues are squeezing profitability for debt-reliant clean energy producers, compounding the challenges of heightened global competition.
- The longer-term outlook is less certain. Technological advances like AI and innovations in nuclear and geothermal energy could accelerate the adoption of clean energy, but much will depend on national priorities.
- An ever-more complex energy system supports an active investment approach, in our view. In public markets, we see opportunities in utilities, grids and electrical equipment supply chains, and value selectivity as performance dispersion grows. We see private markets playing a bigger role to fund the investment needs in energy infrastructure.
Colliding mega forces
A global economic transformation is underway, reminiscent of past technological revolutions, driven by the convergence of several mega forces. This transformation is marked by a wave of capital expenditure (capex) focused on AI, the low-carbon transition and rewiring global supply chains. This is reshaping corporate sectors and redirecting revenue streams, particularly in the global energy system.
The low-carbon transition is unfolding at different speeds across countries and sectors, in our view. That creates diverse risks and opportunities for investors. For instance, annual renewable power investment has increased by US$350 billion a year since 2019, according to the IEA. That is more than double the amount “hyperscalers” – the large tech companies investing heavily in AI – have poured into AI and data centres over the same period. Yet these figures mask very different public market performance. As tech equities have outperformed, clean energy equities have slid since 2019 due to a cocktail of factors, including higher interest rates and heightened global competition. See the Divergence chart below.
These dynamics underscore mismatches between demand, investment and equity performance across energy types like traditional energy, nuclear and power grids. To date, soaring production and investment in clean energy are helping meet new demand rather than displacing fossil fuels. We see three structural currents altering the shape of the transition and reshaping investment opportunities – each presenting opportunities and risks for investors today and having longer term implications for energy systems:
- Growing global power demand: AI-driven development, especially in the US, and building cooling needs in emerging markets have led to a surge in power demand, particularly for large-scale, dedicated capacity.
- Strategic competition in energy: Geopolitical tensions and trade protectionism are reshaping markets for energy technology and critical commodities.
- Shifting energy policy: A series of cascading geopolitical shocks, most prominently Russia's invasion of Ukraine, has spurred a recalibration of energy policy priorities – pressures that will stay central as new leaders come to power in 2025 after a wave of global elections. See Energy at the core schematic below.
Successfully navigating these developments warrants, in our view, a granular and agile approach to identifying opportunities in both public and private markets. In this paper, we explore our outlook for each of these three developments and how they intersect to shape our investment views around energy. We see opportunities in digital infrastructure, power generation and grid expansion as global power demand rises. We also think the natural gas value chain will remain strategically important for governments.
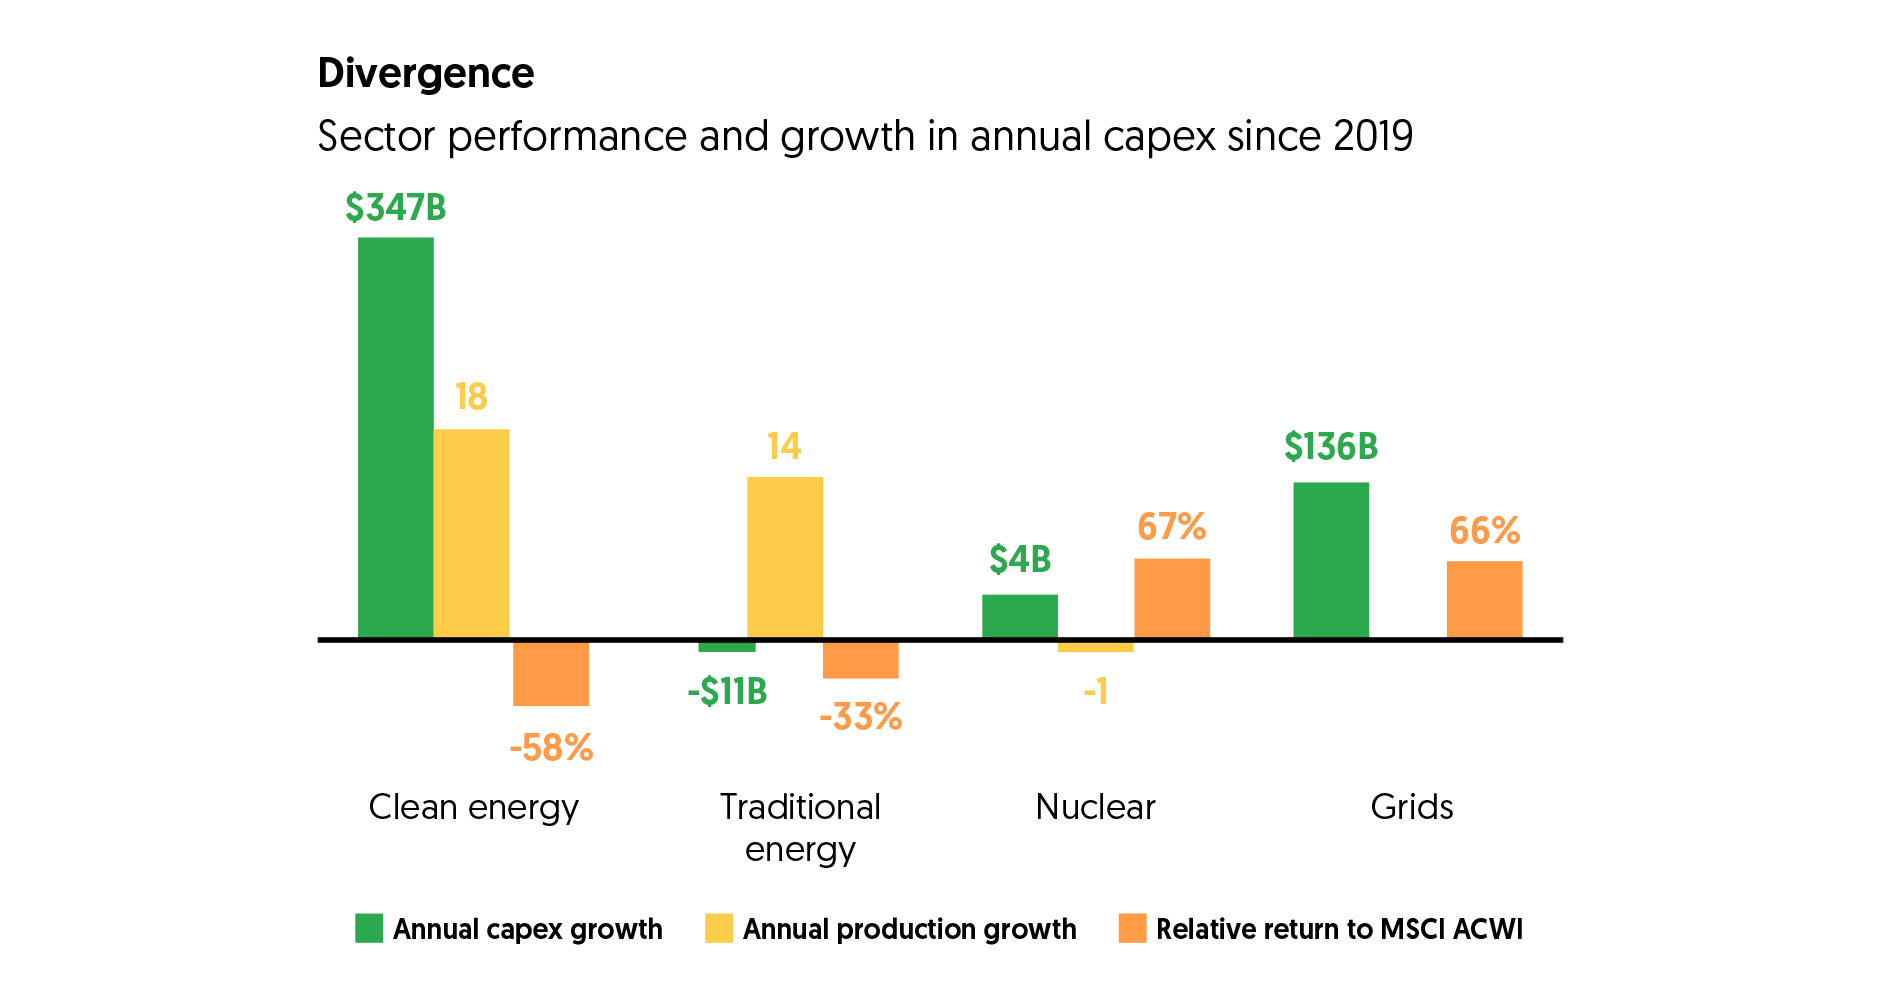
The figures shown relate to past performance. Past performance is not a reliable indicator of current or future results. Index performance returns do not reflect any management fees, transaction costs or expenses. Indices are unmanaged and one cannot invest directly in an index. Source: BlackRock Investment Institute. With data from Bloomberg and International Energy Agency (IEA), and Energy Institute as of December 2024. Notes: The chart shows the average annual returns of selected energy sectors from 2019 to 2024 relative to MSCI All-Country World Index, as well as the annual growth in capital expenditures and production in those sectors since 2019. Index proxies include S&P Global Clean Energy Index (Clean Energy), MSCI World ex AUS Energy Index (Traditional Energy), Solactive Global Uranium and Nuclear Components Transition TR Index (Nuclear), and S&P 1200 ELEC COM&EQU TR index (Grids).
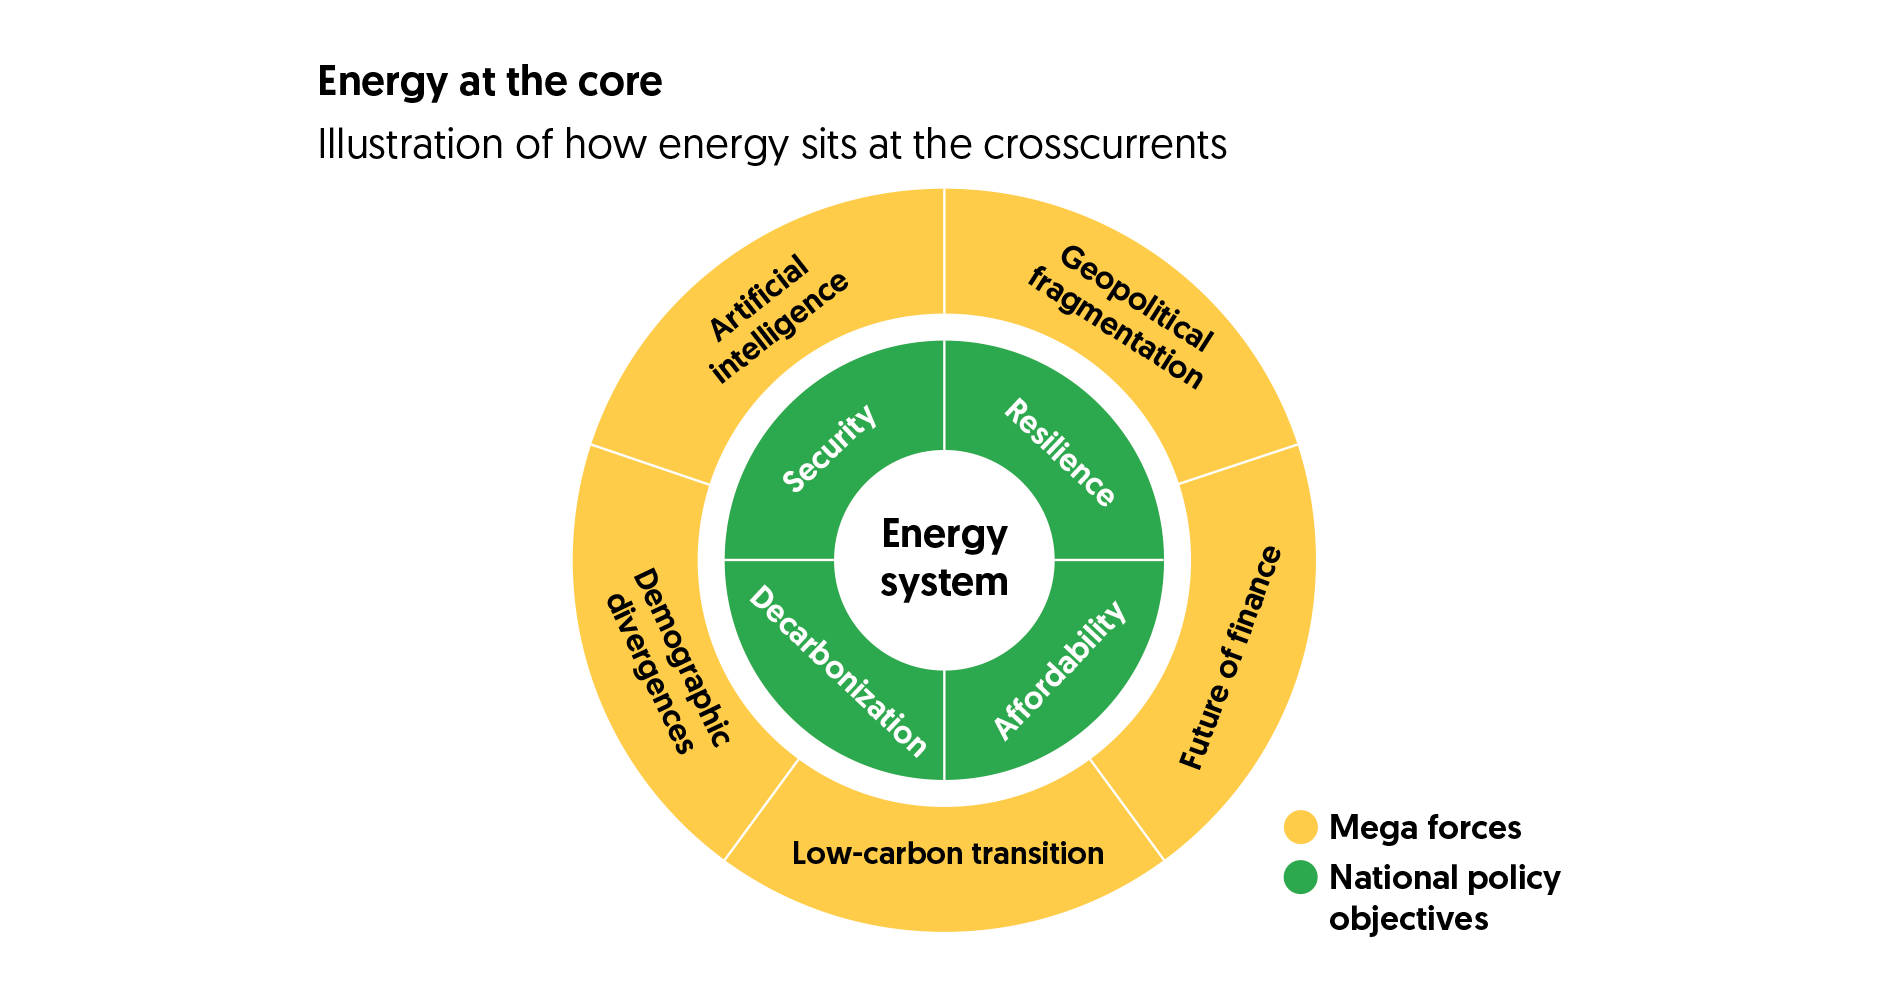
For illustrative purposes only. Source: BlackRock Investment Institute, December 2024. This material represents an assessment of the market environment at a specific time and is not intended to be a forecast of future events or a guarantee of future results. This information should not be relied upon by the reader as research or investment advice regarding any funds, strategy or security in particular.
New and growing power demands
The race to develop AI is triggering a massive real asset buildout, particularly of data centres and the power required to operate them. This marks stage one of the three-phase AI evolution we see unfolding: buildout, adoption, transformation.
This race among fast-moving tech companies is colliding with the highly regulated utility industry. That could strain power grids and push up prices in some areas in coming years, in our view. Globally, AI and data centres (DCs) account for a relatively small share of total power demand growth relative to broader economic expansion and electrification, per the IEA. See the bar on the Rising global power demand chart below. Yet alternative estimates – such as those based on data centre demand rather than supply extrapolations – suggest significantly higher power needs. See the yellow bar on the Rising global power demand chart below.
This global perspective masks concentrated regional growth. For instance, US data centre electricity consumption, now 4% of total national consumption, could rise by between 50% and over 200% by 2030, according to various industry projections. Even at the lower end, this is substantial growth in a country with flat power demand over the past 15 years.
Surging power demand has driven outperformance in US utilities exposed to AI and data centre buildouts. Utilities with higher AI exposure delivered 20% higher returns in 2024 than those with less exposure, as shown in the Dispersion in utilities performance chart below. Their valuations fell in early February 2025 after Chinese startup DeepSeek released a seemingly more efficient AI model but then recovered as US tech reaffirmed their investment plans and markets saw potential for greater power demand if AI model training efficiencies accelerate AI adoption. What type of power is likely to meet this demand? Mega cap tech companies building cloud and AI infrastructure seek power supplies that are always on, low-carbon, cost effective and immediately available – a challenging combination. This is likely to create opportunities across natural gas and renewables in coming years, in our view. Recent agreements between tech firms and both nuclear-heavy utilities and early-stage nuclear startups fuelled market enthusiasm for nuclear-exposed utilities last year.
Beyond AI, other factors are pushing global power demand higher:
- Extreme heat is driving air conditioning adoption, particularly in emerging markets (EMs) with low ownership rates.
- Electrification of buildings and vehicles is expanding, though unevenly across regions.
- Rising incomes, reshoring and industrial growth are compounding electricity demand in key markets like the US and industrialising regions.
Policymakers’ focus on affordable, low-carbon and resilient energy has created a “seller’s market” for always-on, low-carbon sources like nuclear. This points to investment opportunities across power generation, grid infrastructure and the electrical equipment value chain, in our view.
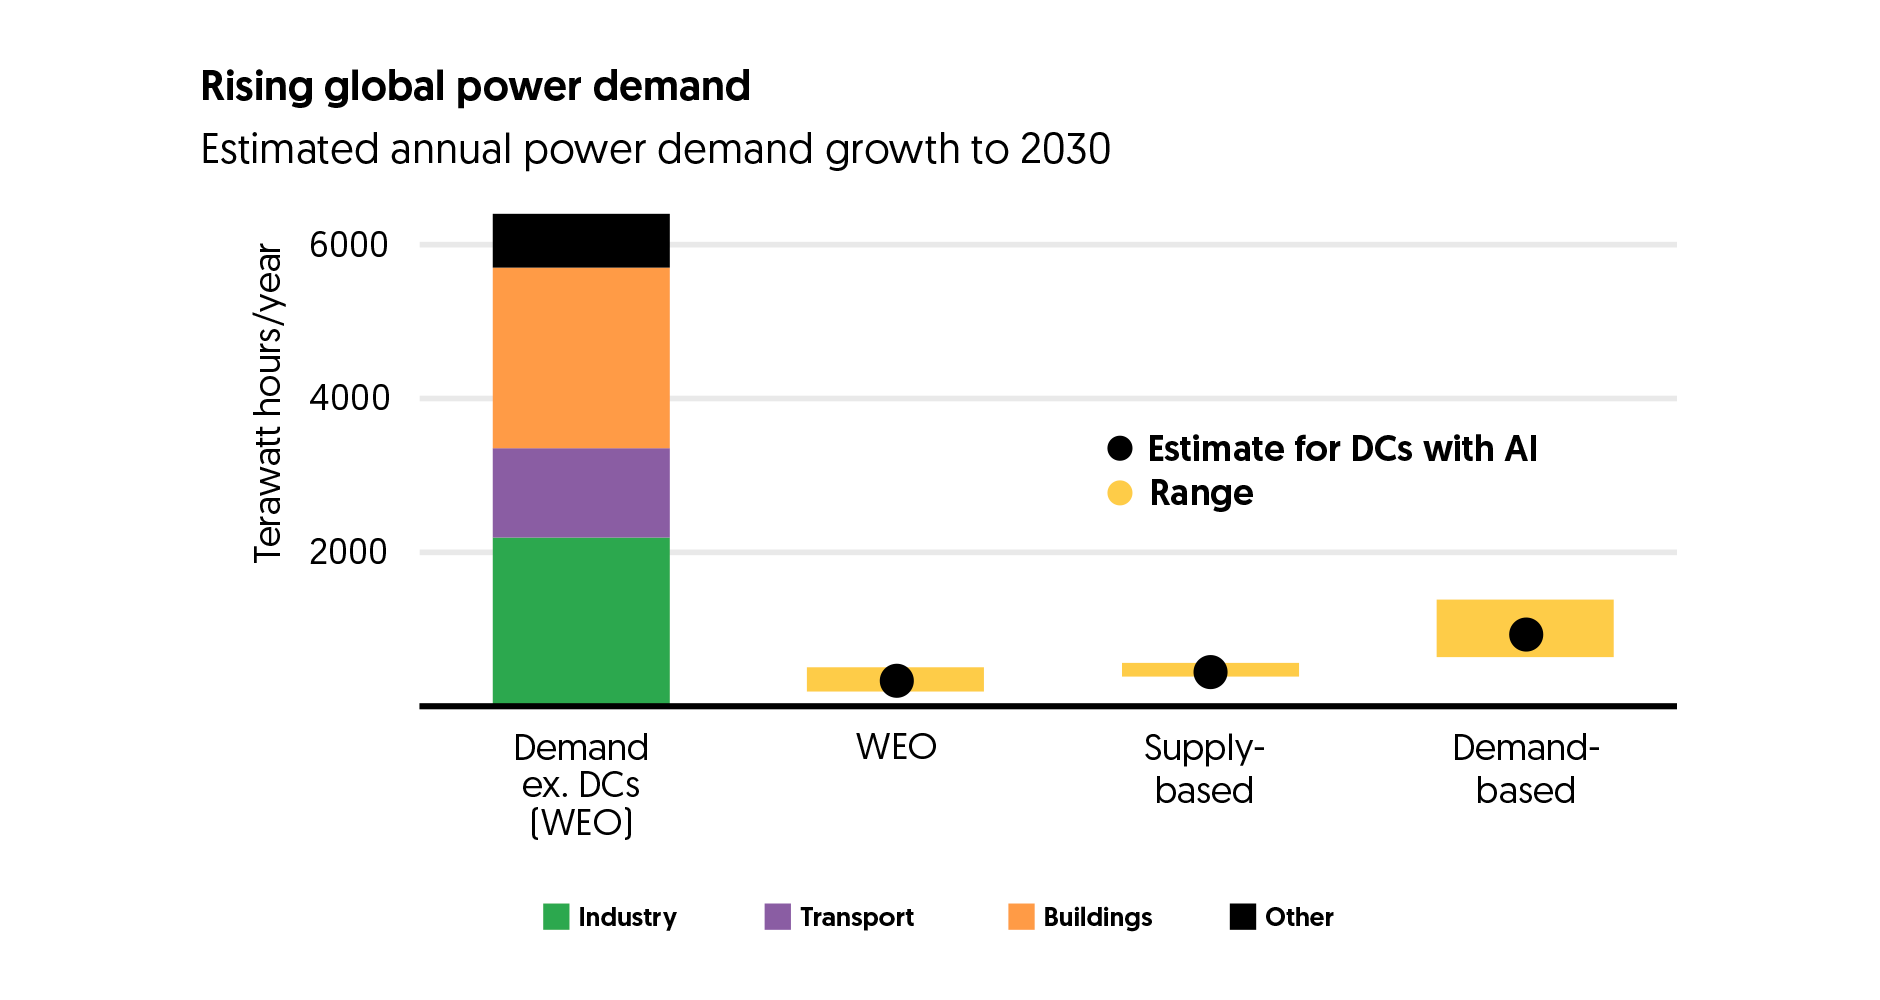
Forward-looking estimates may not come to pass. Source: BlackRock Investment Institute, with data from the International Energy Agency, JP Morgan, Goldman Sachs, Bank of America, Bernstein, Semianalysis, Beringea, McKinsey, Boston Consulting Group, and BlackRock's Global Industrials and Fundamental Equities teams, December 2024. Notes: This chart shows the estimated additional power demand per year between 2023 and 2030. The global total marginal power demand includes sectoral power demand data from the IEA’s World Energy Outlook (WEO) 2024 in the Stated Policy Scenario, October 2024. The median power demand for data centers is calculated by the BlackRock Investment Institute using data from the third-party sources mentioned, as of May 2024. Data center power demand includes those from traditional data centers and artificial intelligence (AI) computing/dedicated AI data centers and excludes consumption from cryptocurrencies and data transmission networks. Data centers demand estimates noted as supply are based on assumptions of GPU shipments, and those noted as demand estimates are based on retail market demand.
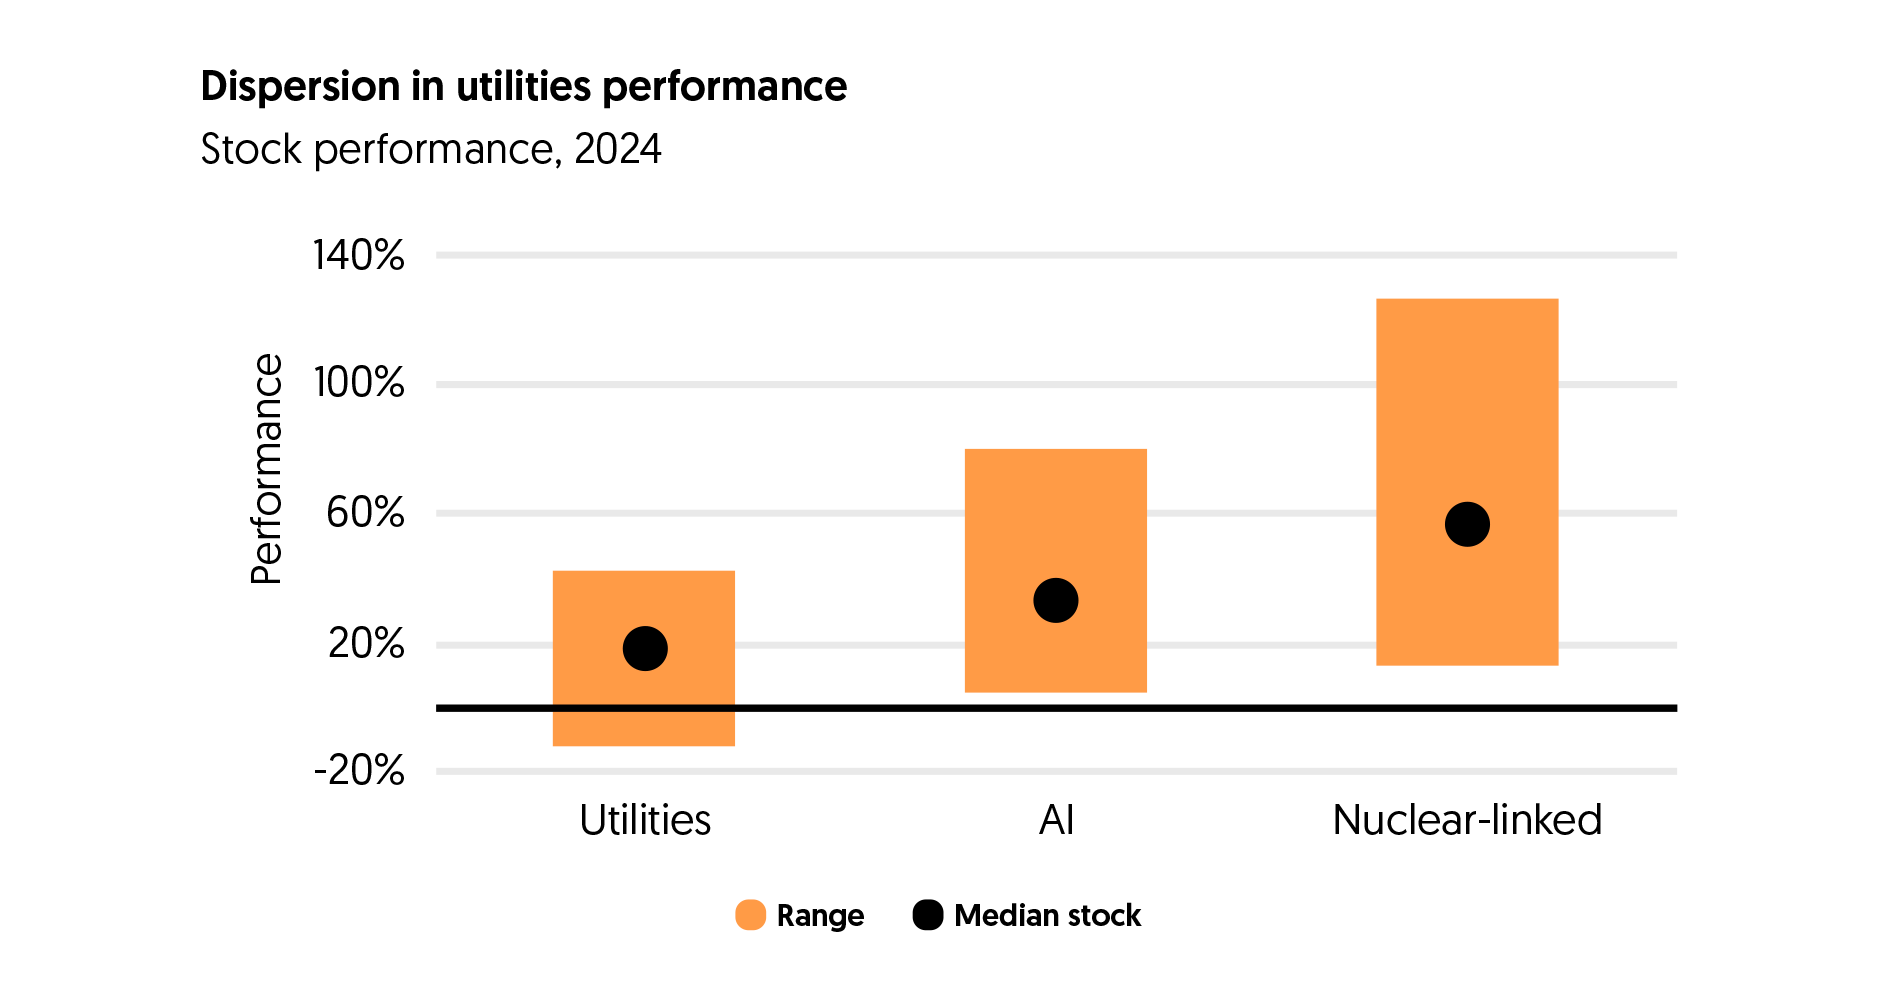
The figures shown relate to past performance. Past performance is not a reliable indicator of current or future results. Index performance returns do not reflect any management fees, transaction costs or expenses. Indices are unmanaged and one cannot invest directly in an index. Source: BlackRock Investment Institute, with data from Bloomberg and Aladdin Climate, December 2024. Notes: The chart shows the median returns of custom-built equity sectors within a range of the top and bottom deciles (90th and 10th percentiles). The data universe is based on the MSCI Utilities Index. The first bar represents a segment of utilities and independent power producers (IPPs) in the U.S. The middle bar represents a segment of utilities and IPPs that we classified as beneficiaries of artificial intelligence (AI), based on our review of sell-side reports and investor interviews. The right bar represents a subset of U.S. utilities with over 15% of their total power generation capacity coming from nuclear energy.
Strategic competition and energy
The link between geopolitics and energy security, forged since the 1970s oil shocks, remains central to today’s global energy landscape. Yet rising non-OPEC production, strategic reserves and muted oil demand growth suggest geopolitical events may exert less pressure on oil markets than before, in our view. Instead, strategic competition in energy and industrial policy – where governments prioritise domestic industries – is shifting focus from traditional energy and commodity markets to low-carbon technologies and critical minerals.
China’s export-oriented manufacturing strategy has prioritised key low-carbon sectors – particularly solar photovoltaic (PV) cells, batteries and electric vehicles (EVs). Across these technologies, estimates from the IEA suggest Chinese manufacturing capacity exceeds current global demand by 5% to 140%, as shown in the Supply-demand imbalances chart below. This oversupply has helped drive down prices globally. For example, lithium battery prices plunged 20% in 2024, according to an analysis by BNEF. Lower prices have spurred adoption, yet they have also pressured profit margins, particularly in regions without trade protections.
Solar PV production underscores the risks of supply-demand imbalances. In 2023, Chinese solar panel supply exceeded global demand by 100%, creating significant overcapacity, according to the IEA. Policymakers in several regions have introduced measures to address the national challenges arising from China’s increasing role in clean tech manufacturing. These responses take two forms:
- Incentives, such as subsidies, to promote local production.
- Barriers, like tariffs on imports, to shield domestic manufacturers, such as the US and European Union’s recent restrictions on Chinese electric vehicle imports.
The US Inflation Reduction Act and the EU’s Net Zero Industry Act combine these approaches, pairing subsidies with stringent supply chain requirements. Both forms of response have the same implications. Such policies have bolstered profitability for domestic industries, evident in the recovery of US solar margins in 2023. They also create wide divergence in profitability globally, leaving manufacturers in less-protected regions exposed to overcapacity pressures. See the Margin divergence graph below.
The 2024 US election results are likely to accelerate certain trends in trade and energy policies, emphasising onshoring segments of supply chains. For example, we expect both broad-based and targeted tariff action – some of which we’ve already seen in the early days of the new US administration – to affect trade in traditional and low-carbon energy. Beyond the impacts on supply chains, these tariffs could, in certain instances, provoke retaliatory measures from key trade partners, introducing inefficiencies in energy markets and complicating the global shift to low-carbon technologies. These developments may also drive greater return dispersion across affected equities.
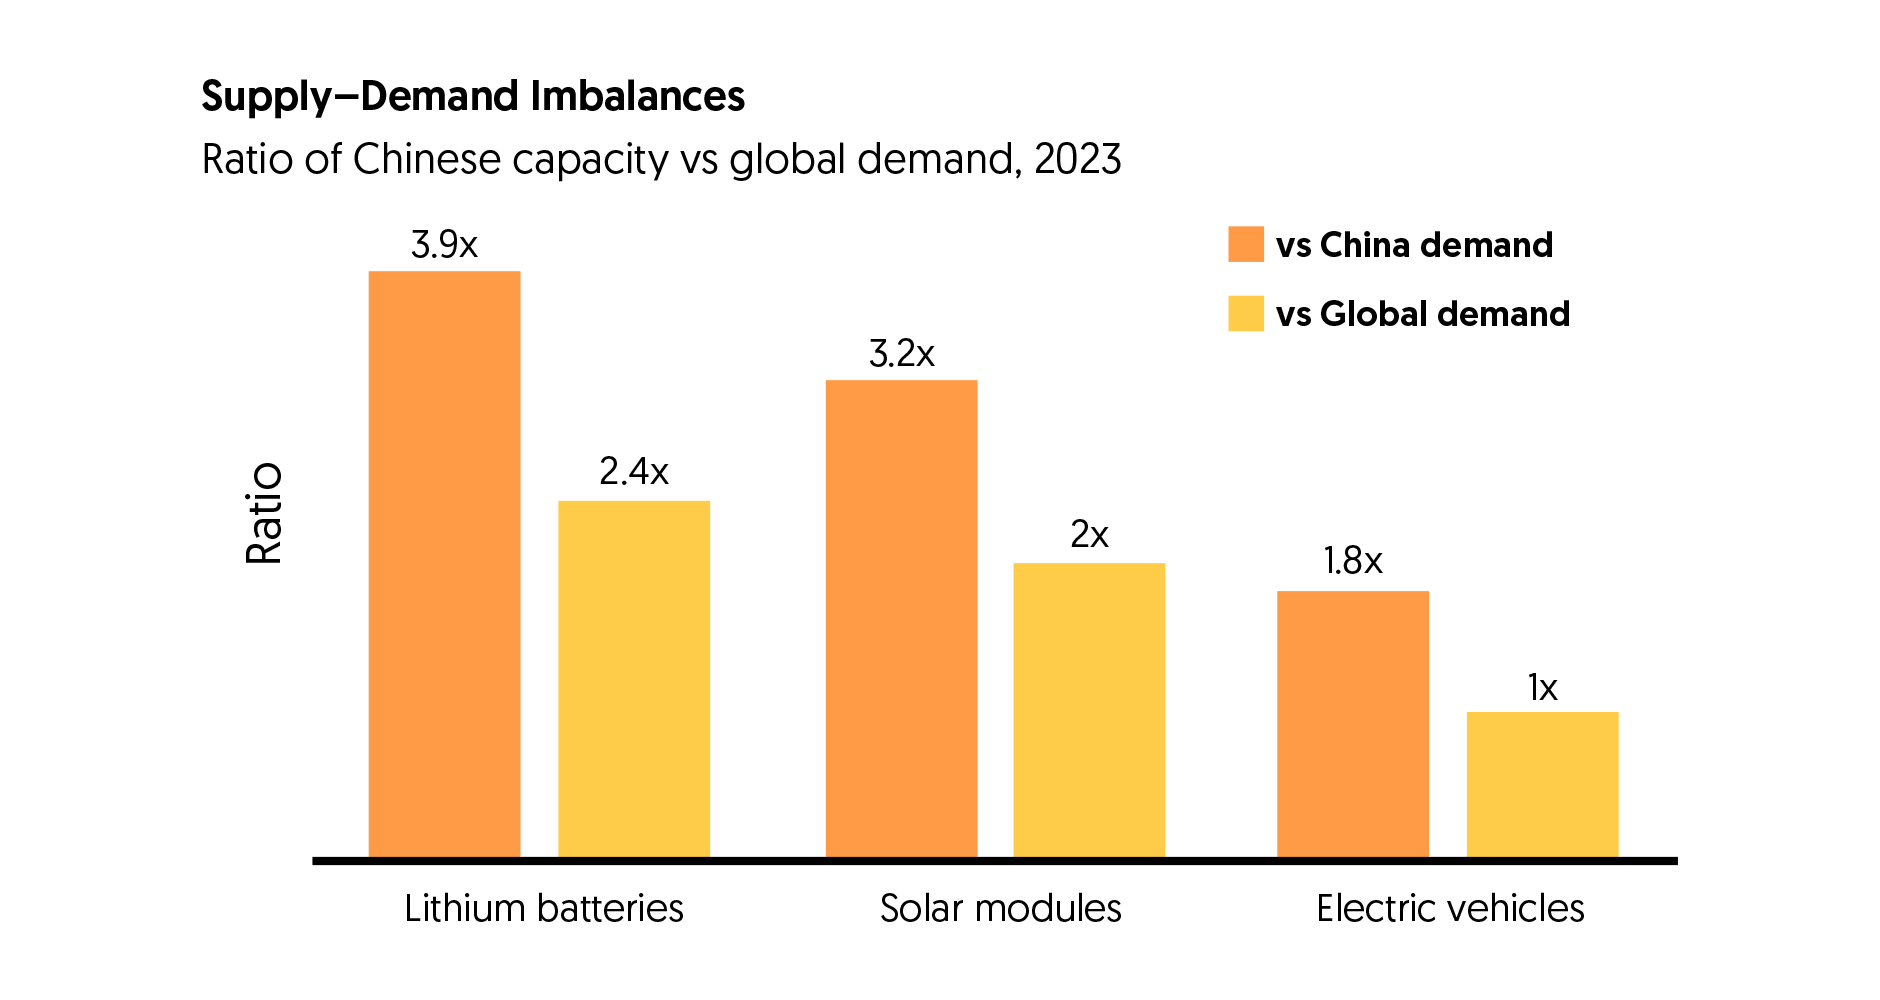
Source: BlackRock Investment Institute with data from International Energy Agency (IEA), October 2024. Notes: The bars show the ratio of China’s manufacturing capacity for various items compared to domestic and global demand for those items. Manufacturing capacity refers to total manufacturing capacity without discounting utilization factors. EV refers to electric passenger cars and pickup trucks. Battery demand includes all EV types and stationary storage.
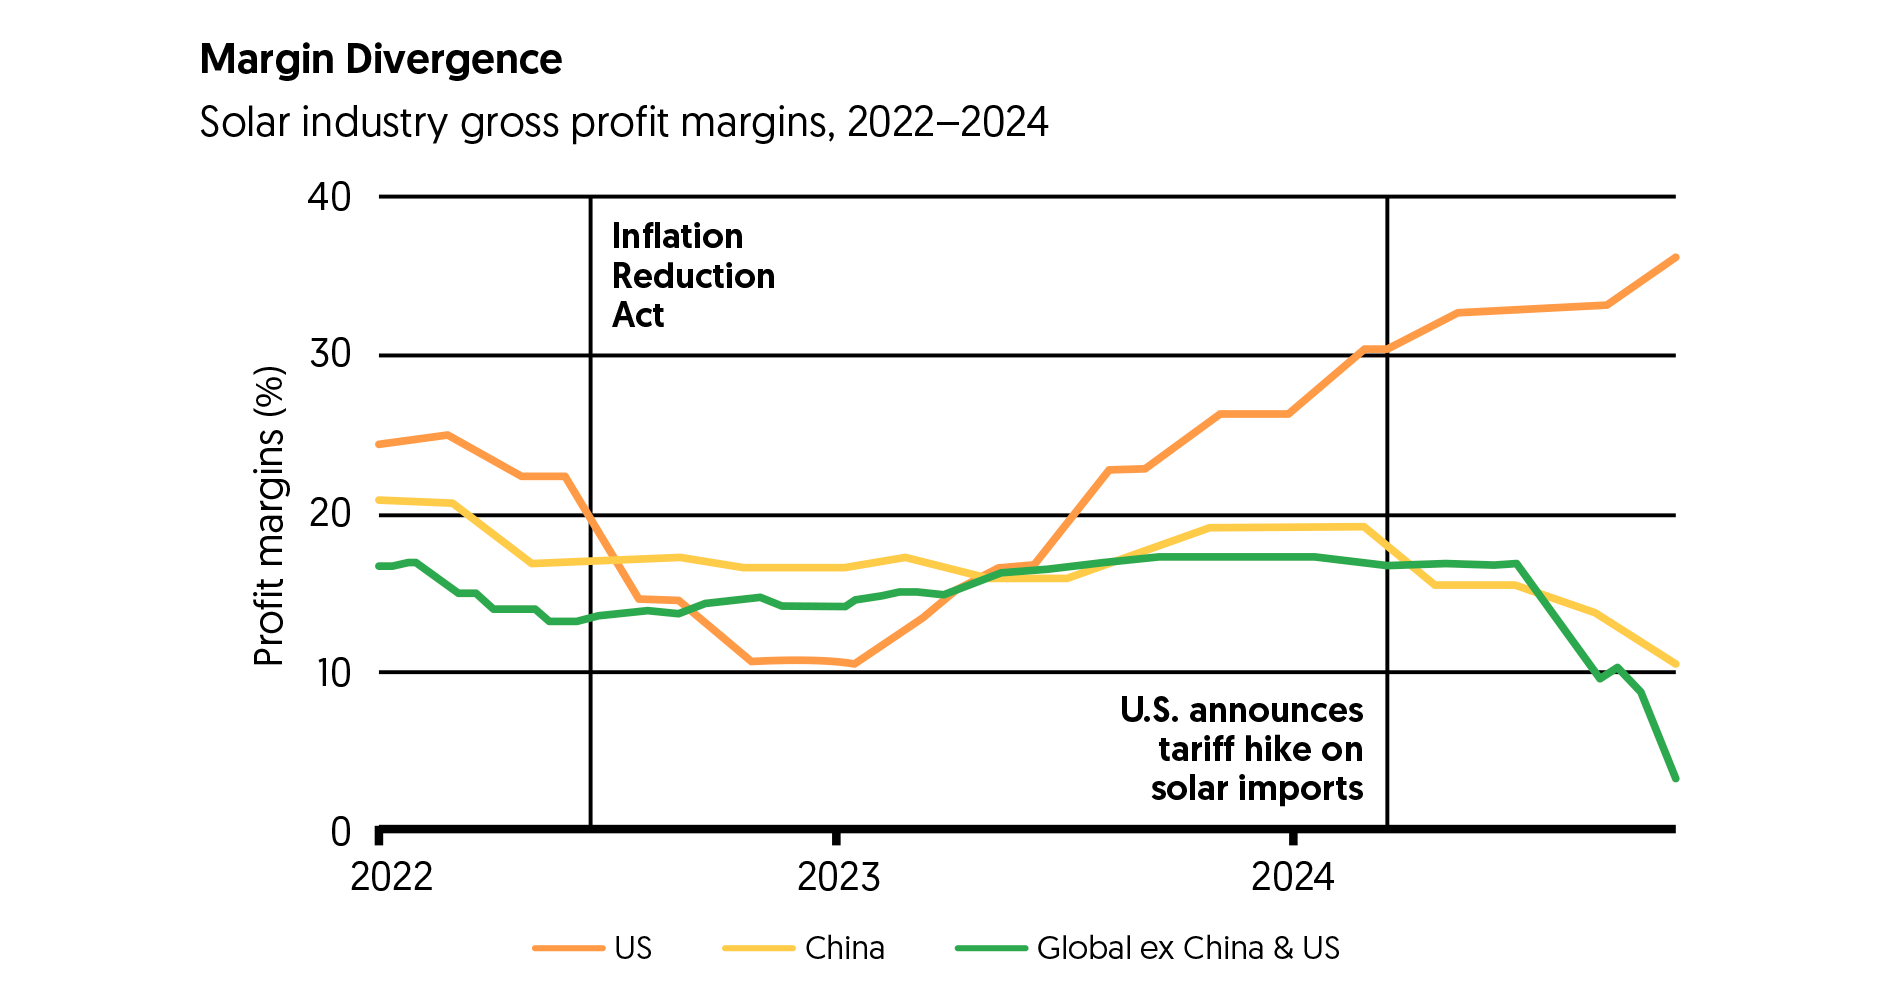
Past performance is not a reliable indicator of current or future results. Source: BlackRock Investment Institute with data from Bloomberg, December 2024. Notes: The chart shows the 60-day median average of gross profit margins for selected regional manufacturers in the solar industry, including makers of solar modules, equipment and investors.
Shifting energy policy priorities
The energy crisis triggered by the Ukraine conflict had already prompted a global recalibration of energy priorities, and 2024 election outcomes globally may amplify these shifts. Leadership changes in 32 of 59 countries reflect affordability concerns and evolving voter priorities, in our view. These concerns, plus growing energy demand, could mean some countries deprioritise decarbonisation if it misaligns with abundance and security. We see the pre-existing trend toward energy policy recalibration and the 2024 electoral changes as creating three distinct near-term trajectories for energy and climate policy across regions, as illustrated in the multi-speed transition chart below.
Status quo: Regions without elections or with incumbent leadership signalling continuity, like India, Russia and Japan.
Slowdown: Countries or regions where leadership changes or parliamentary shifts favour traditional energy or recalibrate clean energy support, including the US, the European Union (EU) Parliament and Austria.
Growing priority: Nations embracing clean energy transitions, led by new leaders advocating ambitious policies, such as in the UK and South Africa, or through increased policy support.
This reflects our view of how potential policy changes may shape the prioritisation of the low-carbon transition across regions. Yet, these shifts are inherently political, and existing transition speeds must also be considered. For example, faster-moving regions like the EU remain ahead of slower counterparts, even with potential policy adjustments.
We expect the most significant energy policy shifts in the US, with some already enacted through executive orders. Likely changes include rollbacks on vehicle efficiency standards, reduced clean energy incentives and expanded domestic oil and gas production, supported by deregulation. Yet these changes are unlikely to halt clean energy growth. For example, BNEF analysis finds that a total repeal of the tax credits provided by the US Inflation Reduction Act would result in only around 17% less additional capacity over the next decade. In the EU, policies increasingly favour decarbonisation, though 2024 parliamentary elections and developments in Germany and France also point to some recalibration – such as the delayed EU Deforestation Law. We expect the clean energy buildout to continue as the EU looks to boost industrial competitiveness.
Macroeconomic and political uncertainties tied to the 2024 elections are compounding structural challenges – delays in siting and permitting, supply chain disruptions and rising power demand. These factors, as highlighted by over 100 BlackRock experts, could limit the speed of clean energy adoption in the near term, favouring deployable power sources like natural gas to meet urgent needs, even as renewables expand. See the Potential pain points chart below.
In the near term, we expect policy shifts and growing energy demand to limit the speed at which low-carbon energy grows its share of the global energy mix. Yet it is still growing – and we see some medium to long-term opportunities:
- Clean energy in EMs: Faced with barriers in the West, China may look to increase exports to and investment in EMs to soak up excess clean tech capacity. That could speed up decarbonisation in EMs.
- Innovations in clean, always-on power: Deals from big tech signal progress in modular nuclear reactors, fusion, enhanced geothermal and long-duration storage – technologies with transformational decarbonisation potential.
- AI reshaping energy use: AI may eventually curb energy demand via grid optimisation, efficiency gains and materials innovation, potentially shifting where profits are generated and creating opportunities in new business models.
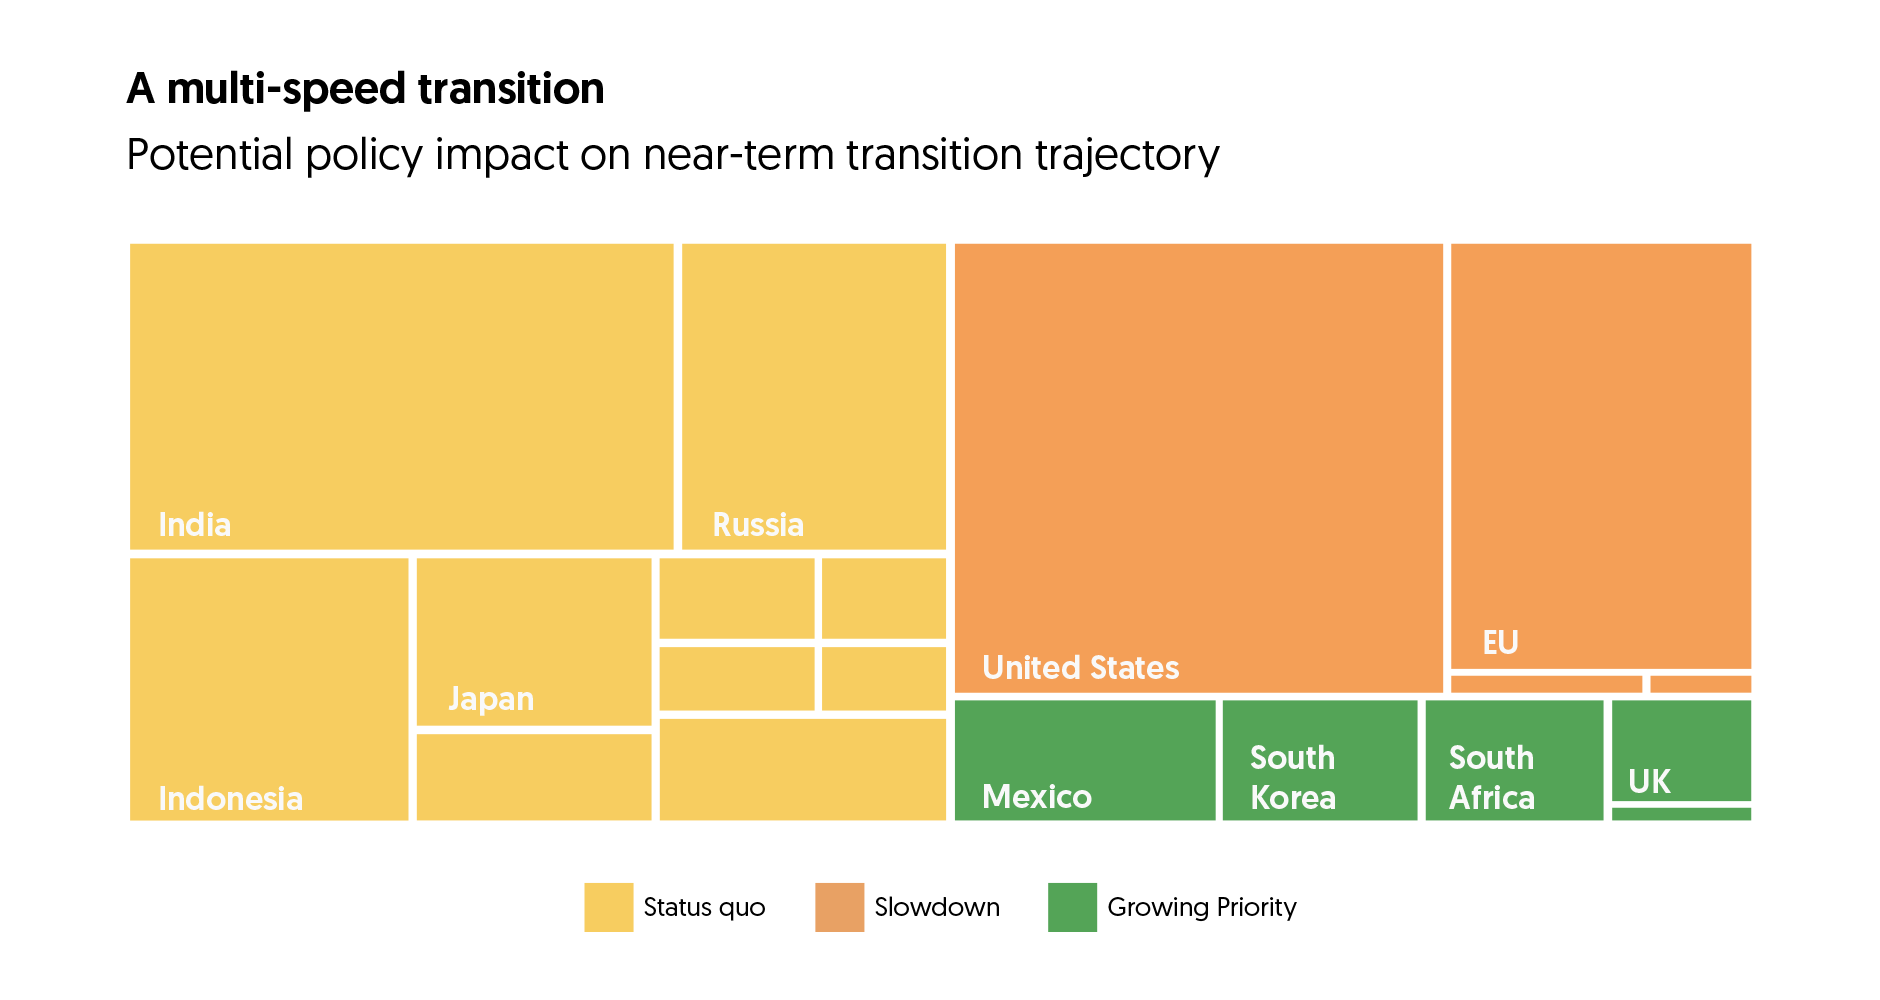
Source: BlackRock Investment Institute, December 2024. Notes: The chart illustrates our view of the likely change – if any – in the priority assigned to the low-carbon transition relative to other policy objectives in each jurisdiction, based on the stated preferences of 2024 election winners. The size of each block corresponds to the total level of emissions. EU refers to the European Union, although climate and energy policy is shared between the European Parliament and member states.
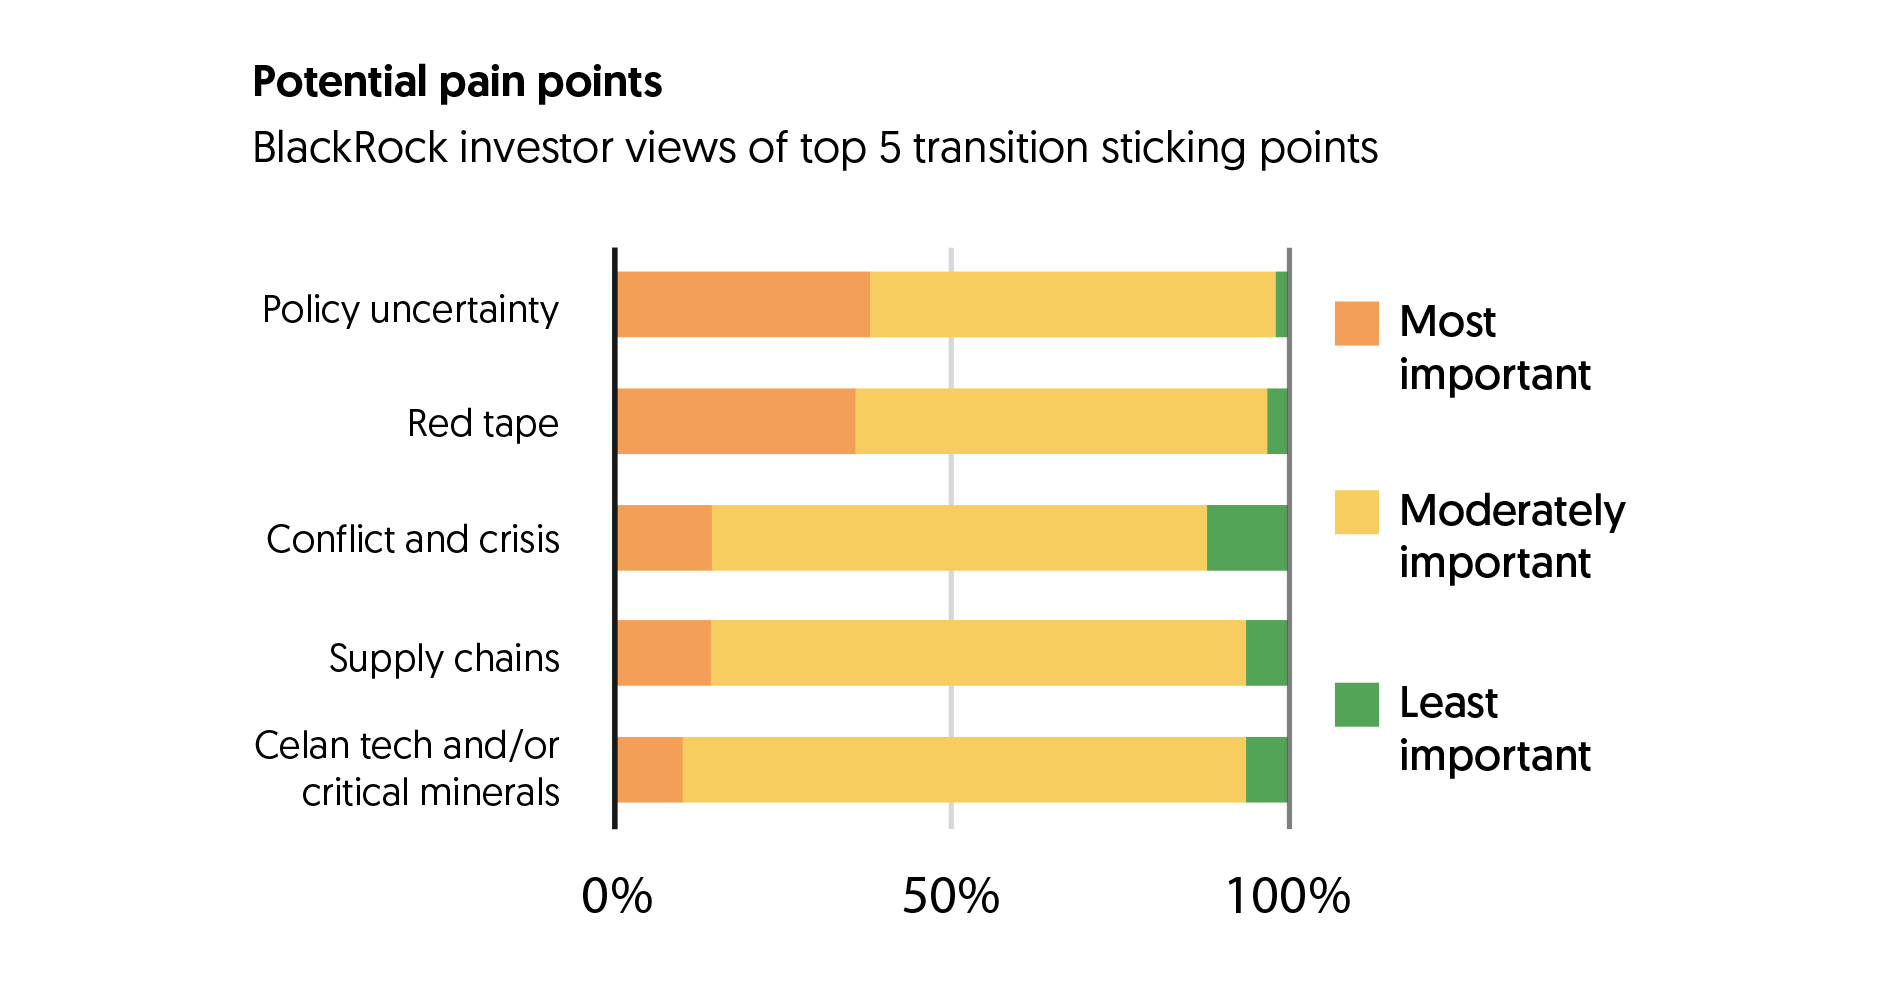
This material represents an assessment of the market environment at a specific time and is not intended to be a forecast of future events or a guarantee of future results. This information should not be relied upon by the reader as research or investment advice regarding any funds, strategy or security in particular. Source: BlackRock Investment Institute, August 2024. Notes: The chart shows the survey results of a poll of 109 low-carbon transition-focused BlackRock portfolio managers and professionals in the first half of 2024 on various topics linked to the low-carbon transition. The views are weighted, benchmarked, and parameterized within BlackRock’s Aladdin Transition Scenario Engine, which powers the BlackRock Investment Institute Transition Scenario (BITS) (for professional investors available here). Near-term quantitative consensus views from investors carry more weight than long-term quantitative views or qualitative commentary.
Staying active
The ever-more complex energy system we set out above is reshaping where profits are generated, altering competitive advantages and shifting market narratives across regions and technologies. This is occurring alongside a general rise in performance dispersion in the volatile and uncertain market regime. Publicly listed equities exposed to the low-carbon transition have experienced significant rotations between sectoral and thematic winners and losers, as seen in the Big rotations within energy stocks chart below. We believe this reflects broader economic changes driven by colliding mega forces, reinforcing the importance of an active investment approach across public and private markets.
Within this volatility lies opportunity, in our view. Staying active in public markets requires identifying evolving market narratives and making timely adjustments. For example, the sequential outperformance of clean tech, followed by traditional energy, and later nuclear and grids, highlights the importance of adapting to shifting themes as the AI trade gained momentum. Success also depends on choosing the right companies within sectors and themes, which requires granular exposure to shifting policies and fragmented supply chains.
Looking ahead, we see potential in areas where sentiment could rebound, including companies poised to benefit from trade protections, adjustments to green incentives and the ongoing buildout of power and grid infrastructure to meet rising energy demands. Permitting reforms, shifting energy policies, and rising demand also point to opportunities in traditional energy sectors.
Companies at the intersection of multiple themes may offer unique advantages. For instance, firms leveraging AI to advance low-carbon strategies combine exposure to mega forces driving transformation. To illustrate, we identified four baskets of companies: AI builders offering sustainable products or services, AI adopters offering sustainable products or services, AI builders with sustainable operations and AI adopters with sustainable operations. Since 2019, all four groups have outperformed the broad market. See the Opportunities at the crosscurrents graph below.
Private markets and infrastructure are among the largest capital deployment opportunities in the low-carbon transition, in our view. They also often include features to help offset the impact of inflation. Public markets remain key, yet most of the deal flow supporting transition investments is emerging from private channels. Digital infrastructure, power generation and grid expansion are set to play a central role in the transition. The natural gas and energy storage value chains remain strategically important for governments, providing essential grid stability as the world transitions to cleaner, but more intermittent, energy systems.
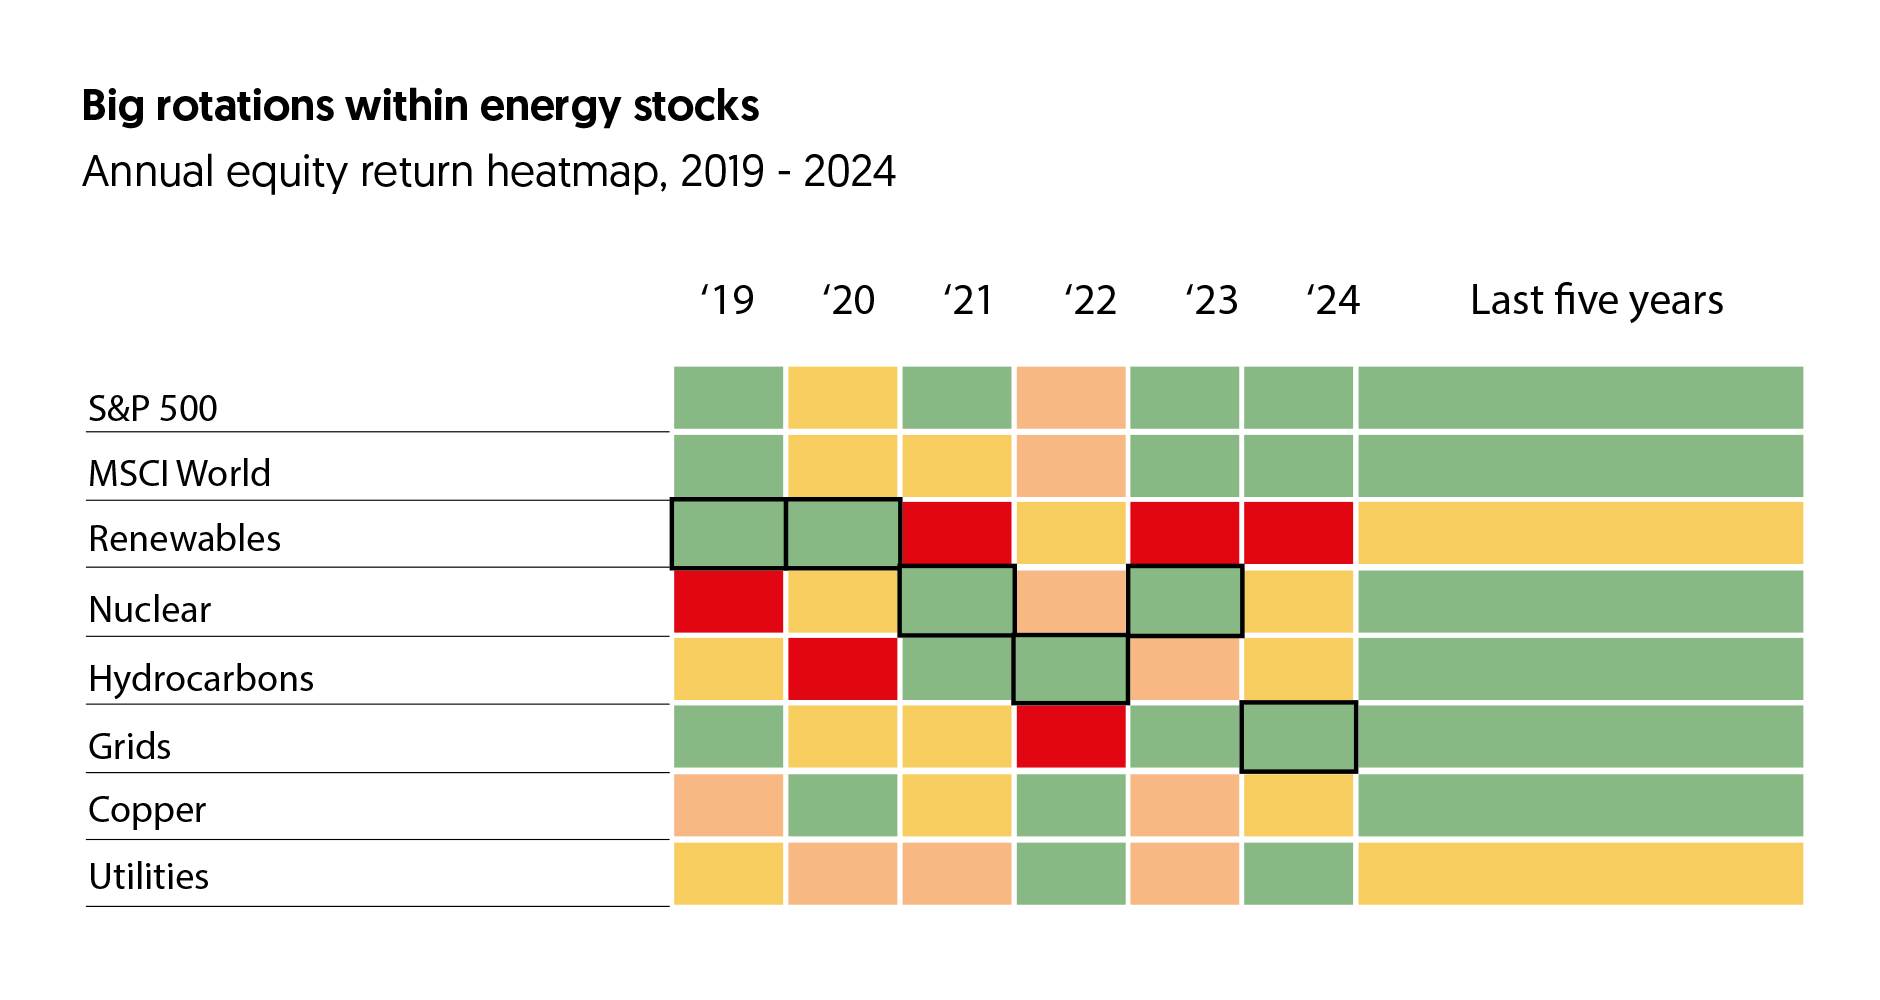
The figures shown relate to past performance. Past performance is not a reliable indicator of current or future results. Index performance returns do not reflect any management fees, transaction costs or expenses. Indices are unmanaged and one cannot invest directly in an index. Source: BlackRock Investment Institute, with data from Bloomberg, December 2024. Notes: The heatmap shows the annual and five-year returns for major equity indexes and key energy sectors. Returns are scaled by calendar year, with the lowest values (for that calendar year) in red and the largest values in green. The black boxes indicate the best performing energy sub-sector relative to MSCI World in each respective year. Indices used: S&P Global Clean Energy (Renewables), S&P 500, Solactive Global Uranium & Nuclear Components Total Return Index (Nuclear), S&P 1200 ELEC COM&EQU TR Index (Grids), Solactive Copper Miners Index (Copper), MSCI World ex AUS Utilities Index (Utilities), MSCI World ex AUS Energy Index (Hydrocarbon), and MSCI World Index (MSCI World).
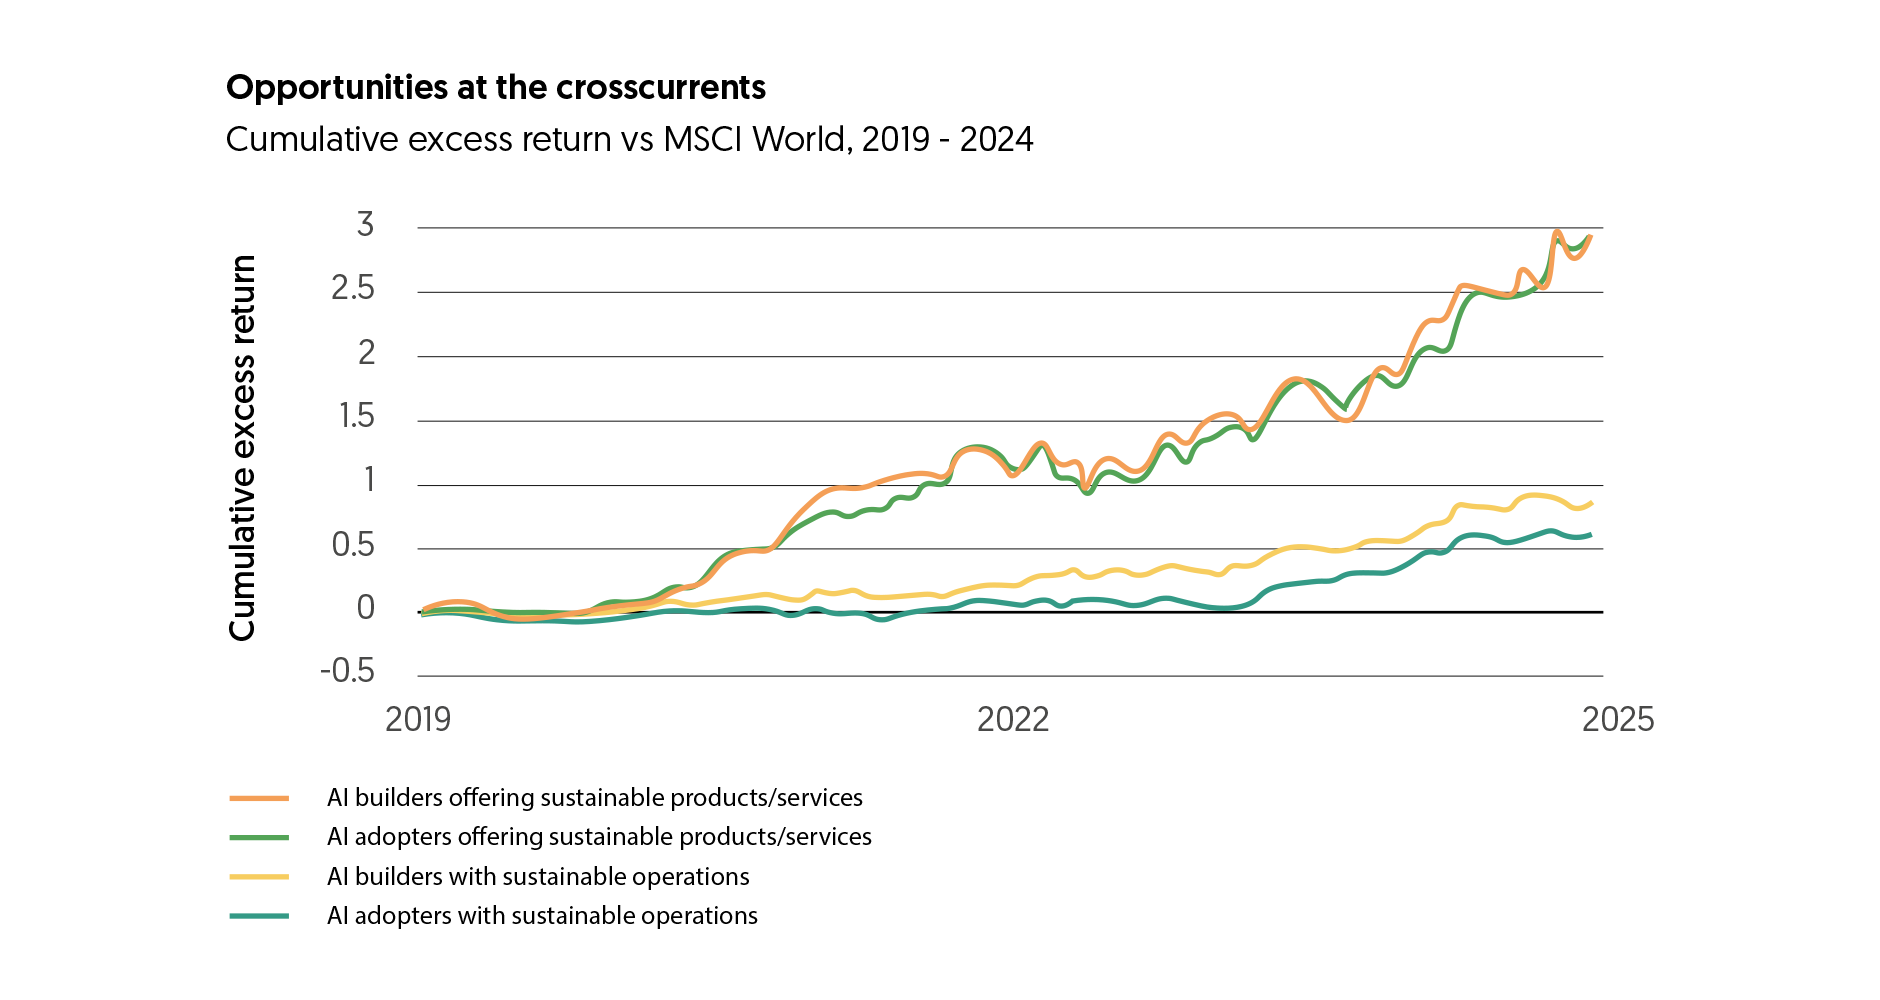
The figures shown relate to past performance. Past performance is not a reliable indicator of current or future results. Index performance returns do not reflect any management fees, transaction costs or expenses. Indices are unmanaged and one cannot invest directly in an index. Source: BlackRock Investment Institute (BII), as of December 2024. Note: The chart shows cumulative excess return of equal-weighted baskets of selected issues from Jan 2019 to Dec 2024, relative to returns of an equal-weighted basket of MSCI World constituents as of Dec 2024. Issuers (-MSCI All Country World Investable Market Index, or MSCI ACWI IMI) are assigned thematic exposures scores (AI builders/users, sustainable products/services, and sustainable business operations) based on fundamental and quantitative analysis. Relevant cross-current constituents are screened using defined thresholds. Offering sustainable products/services: Companies producing goods, or services that reduce/remove GHGs, minimize natural capital impacts, or support relevant supply chains. Sustainable operation: Companies with high E,S and G scores or actively transitioning business practices for a low-carbon economy. AI builders: Companies producing products/services enabling AI development and benefiting from AI capex spending. AI adopters: Companies expected to use AI to enhance offerings, efficiency, or costs.
Disclaimers by BlackRock Investment Institute
The BlackRock Investment Institute (BII) leverages the firm’s expertise to provide insights on the global economy, markets, geopolitics and long-term asset allocation – all to help our clients and portfolio managers navigate financial markets. BII offers strategic and tactical market views, publications and digital tools that are underpinned by proprietary research. General disclosure: This material is intended for information purposes only, and does not constitute investment advice, a recommendation or an offer or solicitation to purchase or sell any securities to any person in any jurisdiction in which an offer, solicitation, purchase or sale would be unlawful under the securities laws of such jurisdiction. This material may contain estimates and forward-looking statements, which may include forecasts and do not represent a guarantee of future performance. This information is not intended to be complete or exhaustive. No representations or warranties, either express or implied, are made regarding the accuracy or completeness of the information contained herein. The opinions expressed are as of February 2025 and are subject to change without notice. Reliance upon information in this material is at the sole discretion of the reader. Investing involves risks.
Important information
This advertisement has not been reviewed by the Monetary Authority of Singapore. Cross-Border Market Disclaimers


