
We only share with you stock ideas that we are convinced of ourselves.
What you are about to see in this publication is a distillation of the top equity calls from the research teams at OCBC Group, comprising 16 highly experienced equity analysts.
Our equity analysts offer independent research views on a wide range of equities through regular company visits and management meetings.
With good access to listed companies and key industry sources, the research team conducts fundamental, technical and quantitative analyses on companies, while regularly reviewing the stocks covered.
As you can see, we're going to great lengths to help you grow your wealth. And we hope you will find the insights we offer in this publication useful.
Amazon is still the most disruptive force to emerge on the retail scene all these while. Traditional retailers find it hard to match its competitive advantage, and Amazon looks likely to maintain its competitive position with an aggressive push into apparel and footwear. Its acquisition of Whole Foods marks a significant inroad into the grocery category. With more than half of the world's Internet users coming from developing markets, Amazon has promising international growth opportunities, including Europe, Japan and India. Amazon’s more than 300 million global active users and recent fulfilment infrastructure, technology, and content investments are likely to help buffer any uneven margin expansion trajectory brought on by global logistics and content investments, new sources of competition or physical store aspirations. Amazon’s web services products may face competition from well-capitalized peers like Microsoft and Google, potentially exposing it to more aggressive price competition and longer-term margin pressures but Kindle products and complementary devices like Fire TV, Dash, Echo, and Alexa represent intriguing customer acquisition and retention tools that capitalize on the shift to digital media while simultaneously promoting Prime memberships and AWS' various capabilities.
Source: Bloomberg as at 6 July 2017
Amazon.com, Inc. is an online retailer that offers a wide range of products. The company products include books, music, videotapes, computers, electronics, home and garden, and numerous other products. Amazon offers personalized shopping services, web-based credit card payment, and direct shipping to customers.
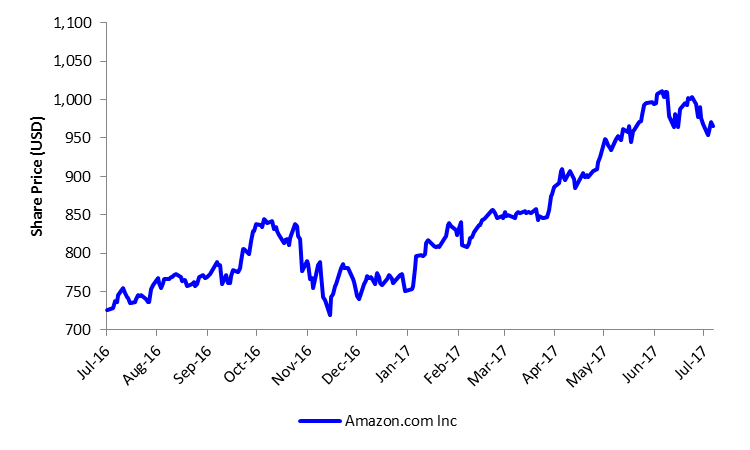
52-Week High: US$1011.3400
52-Week Low: US$719.07000
Source: Bloomberg as at 6 July 2017
For the Financial Year ended 31 December
The contents in this page are a summary of the investment ideas and recommendations set out in the Morningstar Equity Analyst Report.
Having teetered on the edge more than once, Citigroup may finally be on the road to rehabilitation. The bank has raised capital, shed assets and bulked up its board of directors and management team with experienced bankers. Management’s focus on buybacks over dividends also provides much needed flexibility. The bank is leveraged to the rise of Asia, Latin America and other emerging markets, while its competitors struggle with lacklustre loan demand in the U.S. and Western Europe. The tag “too big to fail” due to complex operations spanning several continents may still be there, but investors are assured of better sleep over the next decade. The culture that led to Citigroup’s bailout will not be easy to change and the bank may still be too big to manage successfully but Citigroup’s shrinking balance sheet, falling expenses and a lighter regulatory environment provide a perfect combination for capital return over the next five years.
Source: Bloomberg as at 6 July 2017
Citigroup Inc. is a diversified financial services holding company that provides a broad range of financial services to consumer and corporate customers. The company services include investment banking, retail brokerage, corporate banking, and cash management products and services. Citigroup serves customers globally.
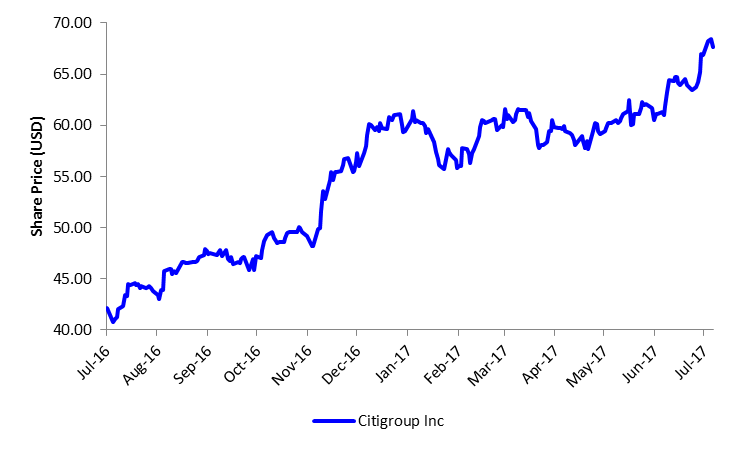
52-Week High: US$68.4500
52-Week Low: US$41.2900
Source: Bloomberg as at 6 July 2017
For the Financial Year ended 31 December
The contents in this page are a summary of the investment ideas and recommendations set out in the Morningstar Equity Analyst Report.
Starbucks is poised for top-line growth and margin expansion through menu innovations, sustainable cost advantages and evolution into a diversified retail consumer and consumer packaged goods platform. There is room for meaningful domestic growth potential in the U.S., despite already being a market leader there, with new store formats and expanded food offerings. This has elevated customer experience, penetrated new dayparts and boosted unit-level productivity metrics. Many of Starbucks’ competitive advantages also apply to international markets, a critical growth engine over the next few decades. Despite its ambitious growth plans, Starbucks should be able to sustain a 45-50 per cent dividend payout ratio over the next decade, implying mid-teens average annual dividend growth. However, commodity cost and foreign currency volatility may disrupt quarter to quarter results. Low switching costs could also mean it could lose consumers to rivals.
Source: Bloomberg as at 6 July 2017
Starbucks Corporation retails, roasts, and provides its own brand of specialty coffee. The company operates retail locations worldwide and sells whole bean coffees through its sales group, direct response business, supermarkets, and on the world wide web. Starbucks also produces and sells bottled coffee drinks and a line of ice creams.
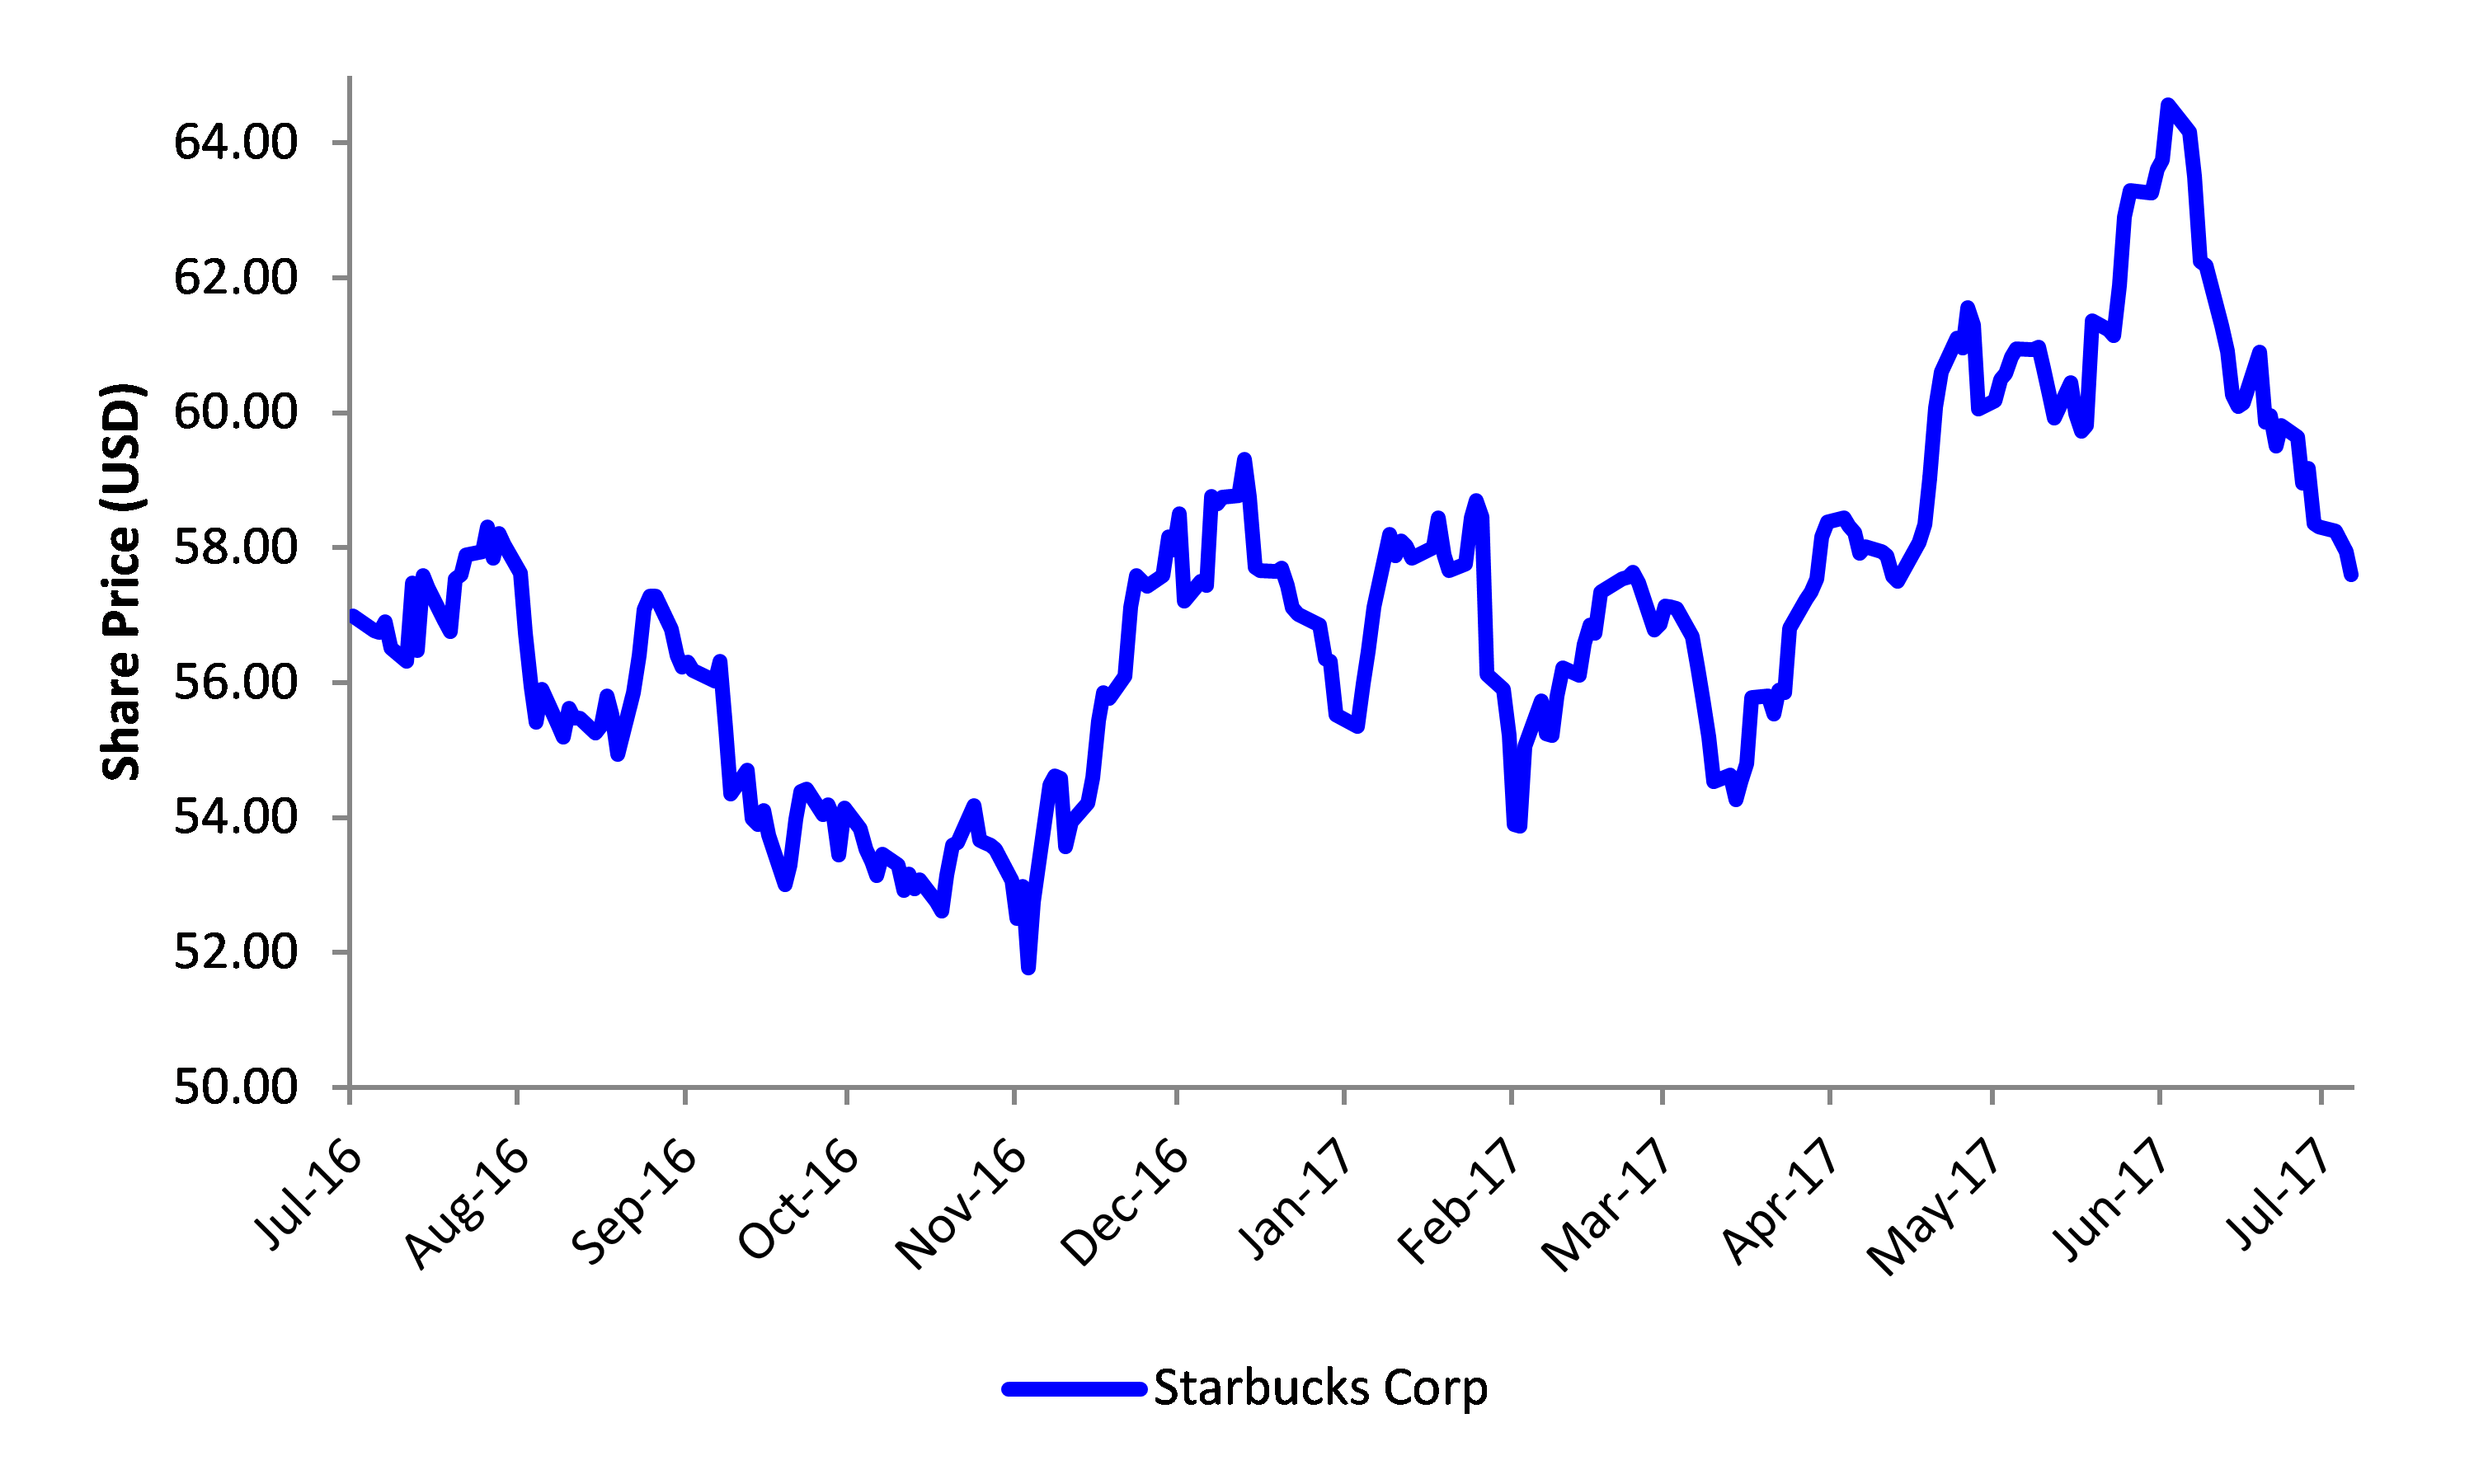
52-Week High: US$64.5700
52-Week Low: US$51.7700
Source: Bloomberg as at 6 July 2017
For the Financial Year ended 31 December
The contents in this page are a summary of the investment ideas and recommendations set out in the Morningstar Equity Analyst Report.
CapitaLand (CAPL) announced that its serviced residence segment, The Ascott Ltd, will acquire for A$180m (S$191m) an additional 60 per cent stake in Quest Apartment Hotels (Quest). This will boost CAPL’s stake to 80 per cent after which the group will become the largest serviced residence provider in Australasia. The acquisition is favourable as Ascott continues to execute its growth plan and expands its presence worldwide. The group remains on track to exceed its target of having 80,000 units in its portfolio globally by 2020. CAPL will also be marking a milestone in its integrated development strategy this year with four project openings in China which comprise over 1m sqm in GFA and will provide significant recurring income for the group. Management have over 6.2m sqm of GFA in terms of integrated development exposure in China, of which more than half is under development. As the green-field component of the group’s portfolio gets developed and becomes operational, CAPL will be well positioned to expand its recurring income base and improve its ROE. Given its leading market share of serviced residences in Australasia, however, CAPL’s revenue in this segment will be heavily reliant on the tourism in Australasia. Also, the growth of e-commerce in China could pose long-term threat to traditional retail and pressure the occupancy rates and future revenues from CAPL’s integrated development projects.
Source: Bloomberg as at 6 July 2017
CapitaLand Limited is a real estate company focused on investment holding. The company and its subsidiaries are principally engaged in investment holding, real estate development, investment in real estate financial products and real estate assets, investment advisory and management services, as well as the management of serviced residences.
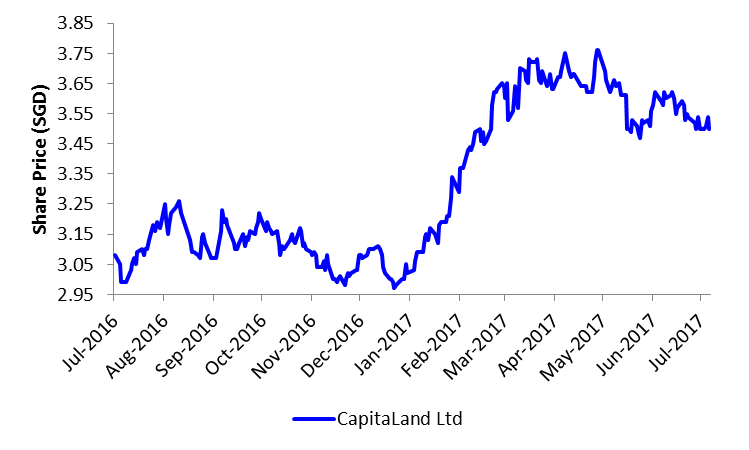
52-Week High: S$ 3.7600
52-Week Low: S$ 2.9700
Source: Bloomberg as at 6 July 2017
For the Financial Year ended 31 December
Frasers Logistics and Industrial Trust (FLT) recently concluded a private placement exercise to issue 78 million new units at an issue price of S$1.01 per new unit. Besides being 4.6 times subscribed, the final issue price came in at the top end of the indicative range of S$0.985 – S$1.01, which we believe reflects the strong sentiment in the market and confidence in FLT’s prospects. FLT had previously indicated that it may fund its proposed acquisition of a portfolio of seven industrial properties in Australia from its sponsor for an estimated total cost of ~A$179.6m using a combination of debt and equity. The net proceeds raised will be used to partially finance this acquisition. We are positive on this proposed transaction as the properties are fully occupied and have a long weighted average lease to expiry (WALE) of 9.6 years. FLT remains as one of our top picks within the S-REITs sector, offering FY17F distribution yield of 6.5 per cent. Key risks to our forecasts include a depreciation of the AUD against the SGD and non-renewal of leases by tenants at the end of their lease terms.
Source: Bloomberg as at 6 July 2017
Frasers Logistics & Industrial Trust is a Singapore real estate investment trust. The Trust invests globally, directly or indirectly, in a diversified portfolio of income-producing real estate assets which are predominantly used for logistics or industrial purposes, whether wholly or partially, as well as such industrial real estate-related assets with an initial focus on Australia.
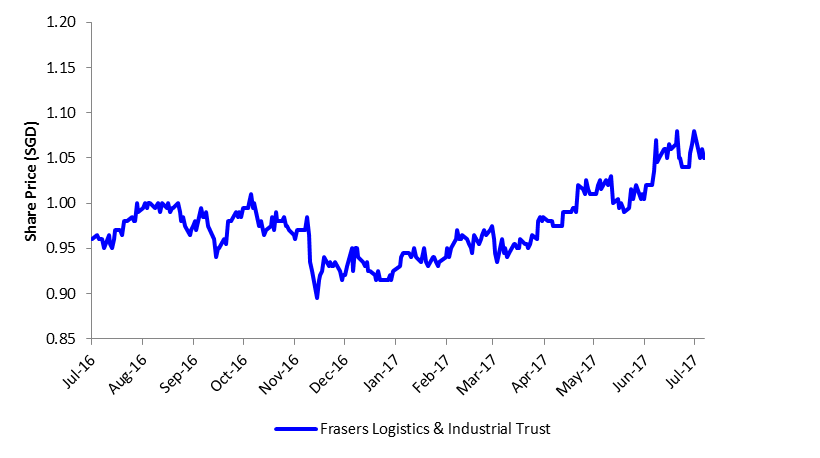
52-Week High: S$1.0800
52-Week Low: S$0.8950
Source: Bloomberg as at 6 July 2017
For the Financial Year ended 31 December
The contents in this page are a summary of the investment ideas and recommendations set out in the Morningstar Equity Analyst Report.
Important Information
The information provided herein is intended for general circulation and/or discussion purposes only. It does not take into account the specific investment objectives, financial situation or particular needs of any particular person.
Please seek advice from a financial adviser regarding the suitability of any investment product taking into account your specific investment objectives, financial situation or particular needs before you make a commitment to purchase the investment product. In the event that you choose not to seek advice from a financial adviser, you should consider whether the product in question is suitable for you.
The Bank, its related companies, their respective directors and/or employees (collectively “Related Persons”) may or might have in the future interests in the investment products or the issuers mentioned herein. Such interests include effecting transactions in such investment products, and providing broking, investment banking and other financial services to such issuers. The Bank and its Related Persons may also be related to, and receive fees from, providers of such investment products.
The information in this document is not intended to constitute research analysis or recommendation and should not be treated as such.
This does not constitute an offer or solicitation to buy or sell or subscribe for any security or financial instrument or to enter into a transaction or to participate in any particular trading or investment strategy.
Any opinions or views of third parties expressed in this material are those of the third parties identified, and not those of OCBC Group.
OCBC Group does not guarantee the accuracy of the information provided herein at any time. All of the information provided herein may change any time without notice. You should not make any decisions without verifying its content. OCBC Group shall not be responsible for any loss or damage whatsoever arising directly or indirectly howsoever as a result of any person acting on any information provided herein.
The information provided herein may contain projections or other forward looking statement regarding future events or future performance of countries, assets, markets or companies. Actual events or results may differ materially. Past performance figures are not necessarily indicative of future or likely performance.
The contents hereof are considered proprietary information and may not be reproduced or disseminated in whole or in part without OCBC Bank’s written consent.
Cross-Border Marketing Disclaimer1. Hong Kong SAR: Oversea-Chinese Banking Corporation Limited (“OCBC Bank”) is an Authorized Institution as defined in the Banking Ordinance of Hong Kong (Cap 155), regulated by the Hong Kong Monetary Authority in Hong Kong. This document is for information only and is not intended for anyone other than the recipient. It has not been reviewed by any regulatory authority in Hong Kong. It is not an offer or a solicitation to deal in any of the financial products referred to herein or to enter into any legal relations, nor an advice or a recommendation with respect to such financial products. It does not have regard to the specific investment objectives, financial situation and the particular needs of any recipient or Investor. This document may not be published, circulated, reproduced or distributed in whole or in part to any other person without the Bank’s prior written consent. This document is not intended for distribution to, publication or use by any person in any jurisdiction outside Hong Kong, or such other jurisdiction as the Bank may determine in its absolute discretion, where such distribution, publication or use would be contrary to applicable law or would subject the Bank and its related corporations, connected persons, associated persons and/or affiliates to any registration, licensing or other requirements within such jurisdiction.
2. Indonesia: The offering of the investment product in reliance of this document is not registered under the Indonesian Capital Market Law and its implementing regulations, and is not intended to constitute a public offering of securities under the Indonesian Capital Market Law and its implementing regulations. According, this investment product may not be offered or sold, directly or indirectly, within Indonesia or to citizens (wherever they are domiciled or located), entities or residents, in any manner which constitutes a public offering of securities under the Indonesian Capital Market Law and its implementing regulations.
3. Japan: The information contained in this document is for general reference purposes only. It does not have regard to your specific investment objectives, financial situation, risk tolerance and particular needs. Nothing in this document constitutes an offer to buy or sell or an invitation to offer to buy or sell or a recommendation or a solicitation to buy or sell any securities or investment. We do not have any intention of conducting regulated business in Japan. You acknowledge that nothing in this document constitutes investment or financial advice or any advice of any nature.
4. Malaysia: OCBC Bank does not hold any licence, registration or approval to carry on any regulated business in Malaysia (including but not limited to any businesses regulated under the Capital Markets & Services Act 2007 of Malaysia), nor does it hold itself out as carrying on or purport to carry on any such business in Malaysia. Any services provided by OCBC Bank to residents of Malaysia are provided solely on an offshore basis from outside Malaysia, either as a result of “reverse enquiry” on the part of the Malaysian residents or where OCBC Bank has been retained outside Malaysia to provide such services. As an integral part of the provision of such services from outside Malaysia, OCBC Bank may from time to time make available to such residents documents and information making reference to capital markets products (for example, in connection with the provision of fund management or investment advisory services outside of Malaysia). Nothing in such documents or information is intended to be construed as or constitute the making available of, or an offer or invitation to subscribe for or purchase any such capital markets product.
5. Myanmar: The relevant Bank entities do not hold any licence or registration under the FIML or other Myanmar legislation to carry on, nor do they purport to carry on, any regulated activity in Myanmar. All activities relating to the client are conducted strictly on an offshore basis. The customers shall ensure that it is their responsibility to comply with all applicable local laws before entering into discussion or contracts with the Bank.
6. Oman: This document does not constitute a public offer of investment, securities or financial services in the Sultanate of Oman, as contemplated by the Commercial Companies Law of Oman (Royal Decree No. 4/1974), Banking Law of Oman (Royal Decree No. 114/2000) or the Capital Market Law of Oman (Royal Decree No. 80/1998) and the Executive Regulations of the Capital Market Law (Ministerial Decision No. 1/2009) or an offer to sell or the solicitation of any offer to buy non-Omani investment products, securities or financial services and products in the Sultanate of Oman. This document is strictly private and confidential. It is being provided to a limited number of sophisticated investors solely to enable them to decide whether or not to make an offer to invest in financial products mentioned in this document, outside of the Sultanate of Oman, upon the terms and subject to the restrictions set out herein and may not be reproduced or used for any other purpose or provided to any person other than the original recipient. Additionally, this document is not intended to lead to the making of any contract within the territory or under the laws of the Sultanate of Oman. The Capital Market Authority of Oman and the Central Bank of Oman take no responsibility for the accuracy of the statements and information contained in this document or for the performance of the financial products mentioned in this document nor shall they have any liability to any person for damage or loss resulting from reliance on any statement or information contained herein.
7. South Korea: The document does not constitute an offer, solicitation or investment advertisement to trade in the investment product referred to in the document.
8. Taiwan: The provision of the information and the offer of the service concerned herewith have not been and will not be registered with the Financial Supervisory Commission of Taiwan pursuant to relevant laws and regulations of Taiwan and may not be provided or offered in Taiwan or in circumstances which requires a prior registration or approval of the Financial Supervisory Commission of Taiwan. No person or entity in Taiwan has been authorised to provide the information and to offer the service in Taiwan.
9. Thailand: Please note that neither OCBC Bank nor any other entities in the OCBC Bank’s group maintains any licences, authorisations or registrations in Thailand nor is any of the material and information contained, or the relevant securities or products specified herein approved or registered in Thailand. Interests in the relevant securities or products may not be offered or sold within Thailand. The attached information has been provided at your request for informational purposes only and shall not be copied or redistributed to any other person without the prior consent of OCBC Bank or its relevant entities and in no way constitutes an offer, solicitation, advertisement or advice of, or in relation to, the relevant securities or products by OCBC Bank or any other entities in OCBC Bank’s group in Thailand.
10. The Philippines: The information contained in this document is not intended to constitute a public offering of securities under the Securities Regulation Code of the Philippines.
11. Dubai/U.A.E: This material is communicated by OCBC Bank. OCBC Bank is not a financial institution licensed in the United Arab Emirates and does not undertake banking or financial activities in the United Arab Emirates nor is it licensed to do so. This material is provided for information purposes only and is not financial advice or a financial promotion, nor is it intended to influence an investor's decision to invest. It is not to be construed as an offer to buy or sell or solicitation of an offer to buy or sell any financial instruments or to participate in any particular trading strategy in any jurisdiction. The material is only intended for persons who fulfil the criteria to be classified as "deemed Professional Clients" as defined under the DFSA rules.
12. United Kingdom: The OCBC Bank is authorised and regulated in Singapore by the Monetary Authority of Singapore. The OCBC Bank is not authorised in the United Kingdom by the Financial Conduct Authority for the conduct of investment business. The services provided by the OCBC Bank are not covered by the UK’s Financial Services Compensation Scheme and neither the Prudential Regulation Authority nor the Financial Conduct Authority supervises or regulates the products or services provided by the OCBC Bank to UK residents.
13. United States of America: This product may not be sold or offered within the United States or to U.S. persons.
© Copyright 2017 - OCBC Bank | All Rights Reserved. Co. Reg. No.: 193200032W