
As stocks and bonds typically do not move in the same direction, investing in both protects your portfolio against volatility.
Bonds diversify your portfolio and provide a steady stream of income. We suggest that you diversify your bond holdings to mitigate the risk of a single bond.
This publication is a distillation of the top bond recommendations from our research team.
Emerging Markets Fixed Income has been at the forefront of our investment offering and the fixed income research group is at the cornerstone of this effort.
The fixed income research group covers roughly 200 credits globally from its base in Singapore. The focus is on bottom-up fundamental analysis, meeting with management teams at company headquarters and conferences around the world.
The team of seven analysts has an average of more than ten years of research experience, ranging from 3 years to 25 years individually.
We hope you will find this publication useful and glean some useful insights from it.
U.S. Dollar Bond
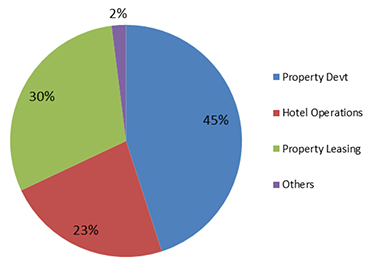
China Jinmao, formerly known as Franshion Properties, is a leading developer and operator of large-scale and high-end properties, both in the commercial and residential markets. Since listing in 2007, the group has grown to a total asset size of RMB188.7 billion. Cash flow from operating activities is negative as the company is in an investment phase, building contracted sales scale leading to the increase in borrowings and leverage. Gross cash flow from operation (before working capital) is positive at RMB 5.15 billion (up 86 per cent YoY) for 1H2017, but when working capital is included, to reflect capital expenditure for future cash flow and contracted sales, it results in a negative cash flow of -RMB11.62 billion, or -RMB4.56 billion YoY. We expect gross margins to be maintained in a range of 30- 35 per cent but leverage could deteriorate slightly with gearing ratio rising to 55 per cent from continued land acquisition. Mitigating the slightly higher financial leverage is its good liquidity position and financial flexibility. China Jinmao has healthy access to external funding channels to support to its long-term expansion strategies. The group’s shareholder structure can be regarded as a credit strength too. China Jinmao is backed by Sinochem Hong Kong (with a 54 per cent stake), GIC Pte Ltd (with 5.91 per cent stake) and Warburg Pincus (with a 4.3 per cent stake). Additionally, its strategy to work with other property partners in major developments should help to alleviate execution risks and related capital requirements. While an increasing proportion of joint venture projects could reduce China Jinmao’s financial transparency, exposure to such projects has remained relatively low, totalling RMB29.2 billion, which is approximately 15.4 per cent of total assets.
China Jinmao Holdings Group Limited invests in and develops real estate projects in China.
Key downside risks: significant slowdown in the Chinese property market in 2H2017, and significant debt funded expansion leading to rating agencies downgrade.
Source: Bank of Singapore
Source: Bank of Singapore
Singapore Dollar Bond
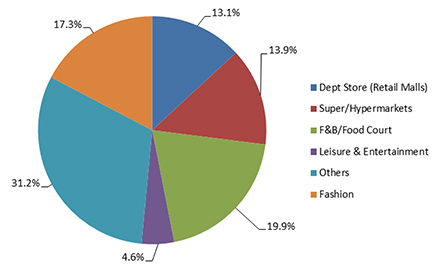
For 2Q2017, Lippo Malls Indonesia Retail Trust (LMRT) revenue and net property income (NPI) increased 6.6 per cent year on year (YoY) and 8.6 per cent YoY to S$49.9m and S$46.8m respectively, mainly due to the acquisition of a retail mall in Kuta and positive rental reversions. LMRT has retained its high portfolio occupancy rate, as strong rental renewals were seen in the Indonesian retail real estate scene (up 13 per cent in 2Q2017). The positive growth in the retail sector has resulted in mall occupancy inching up quarter on quarter to 94.3 per cent (1Q2017: 93.8 per cent). LMRT has acquired S$1.24b of assets since 2011 and is likely to continue its acquisition pace. Its sponsor -- Lippo Karawaci -- has plans to develop 40 new retail malls, which may join LMRT’s pipeline for acquisition in the future. On the back of strong reversions and outlook, we think that LMRT will manage the 18 per cent of leases that will expire in 2017. Aggregate leverage improved to 30.6 per cent (1Q2017: 32.2 per cent) mainly due to the issuance of a S$120m perpetual bond. However, if we were to regard the perpetual bond as half debt, half equity, then aggregate leverage would increase to 36.7 per cent (1Q2017: 35.7 per cent). With strong performance and a positive retail outlook, we continue to hold LMRT at a Neutral issuer profile.
Listed on the SGX on 2007, Lippo Malls Indonesia Retail Trust (LMRT) is a retail REIT with a portfolio of 20 retail malls and 7 retail spaces in Indonesia. The malls are mostly located within Greater Jakarta, Bundung, Medan and Palembang, targeted at the middle to upper-middle class domestic consumers. LMRT is the largest retail S-REIT by floor space, with an NLA of 851,850 sqm. LMRT is 29.85 per cent owned by its sponsor, Lippo Karawaci.
Key downside risks: LMRT is exposed to significant FX risks as it borrows in SGD while its assets are in Indonesia. FX risks are not hedged directly, but we think it is mitigated by the gearing limit of 45 per cent.
Source: OCBC Treasury Research & Strategy
Source: OCBC Treasury Research & Strategy
U.S. Dollar Bond
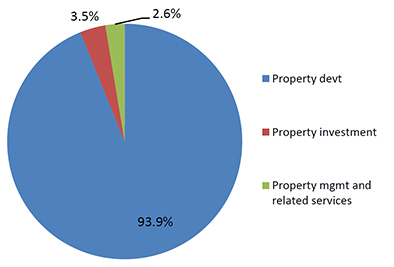
A national property developer, Longfor Properties Co Ltd (Longfor) has a strong presence in Western China, the Pan Bohai Rim and the Yantze River Delta and southern China. It is geographically diversified, its latest foray being Hong Kong in May 2017, although positive impact to the operation will lag a few years. In 2016, Longfor enjoyed contracted sales of RMB88.14 billion, with total revenue of RMB51.44 billion, supported by a geographically diversified project base. During FY2016, about 20 per cent of the company’s revenue from property development was from its home base of Chongqing, supplemented by rental income, primarily from an operating 1.94m sq m land bank. The company has a good operating track record and enjoys stable and moderate credit metrics. As a medium to large sized developer, the company has maintained a moderate growth strategy with revenue CAGR of 32 per cent over the past four years, approximately 10.7 per cent per annum. Contracted sales in Jan-May 2017 were steady, achieving RMB75.75 billion. Recurring income is expected to improve over time to sufficiently cover interest costs over the medium term. At end-Dec 2016, the developer has total attributable land bank of 32.94 million sqm, with an average cost of RMB 4,039/sqm. Despite expectations of higher leverage from its expansion into Hong Kong in May 2017, leverage is expected to be maintained at a level commensurate with its current stable credit profile. Operational risk is low as the company has a good track record of delivering property projects in China since 1994.
Longfor Properties Co. Ltd. operates in the property development, property investment and property management businesses in China.
Key downside risks: sharp downturn in China’s property market, potential governance issue, which is generally high in the Chinese property sector, and change in strategy to grow aggressively.
Source: Bank of Singapore, as at 31 December
Source: Bank of Singapore
Singapore Dollar Bond
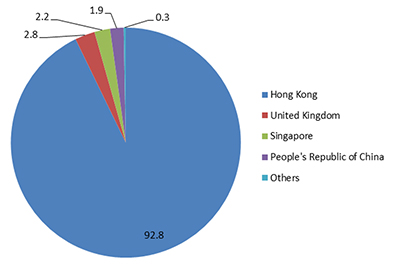
Wing Tai Properties Limited (WTP) reported decent FY2016 results, with revenue rising 9.3 per cent year on year (YoY) to HK$1.1b. This was driven mainly by property investment; its flagship property, Landmark East, recorded a strong 30 per cent upward rental reversion. WTP had also disposed of properties for gains; all in, net profit increased 4.6 per cent YoY to HK$1.1b. Investment properties will continue to be the main driver of WTP’s credit profile, even with the looming supply of office space, as its management has guided for positive rental growth even after the strong rental reversions in 2016. WTP expects rental income and capital value to increase after the completion of the Shui Hing revitalisation project in Hong Kong (conversion from industrial building to office use) and Cavendish Square’s modernisation in London in 2018. WTP is in the process of expanding its hospitality portfolio and residential development which may see a boost in revenue. It renewed its management contract for Lanson Place Jinlin Tiandi Serviced Residences for another seven years in July 2016 and has other projects lined up till 2022. Net debt over equity has increased to 0.14 times (2015: 0.07 times) largely due to settlement for HK$981.6m land purchase for a plot at Castle Peak Road. If the residential projects (Le Cap and La Vetta) sell well, the healthy level of net gearing may inch down going forward. WTP maintains good access to liquidity, with HK$1.7b cash on hand and HK$2.2b unutilized revolving loan facilities.
Wing Tai Properties Ltd. (WTP) invests in and manages real estate. Its premium serviced residences are located in China and Southeast Asia under the brand names of Wing Tai Asia and Lanson Place. Listed in 1991 on the Hong Kong Stock Exchange, it has developed an aggregate GFA of over 5mn sq ft in the luxury residential property projects. WTP is 34.4 per cent owned by Wing Tai Holdings Ltd and 13.7 per cent-owned by Sun Hung Kai Properties Ltd.
Key downside risks: (1) Downturn in the Hong Kong property market, (2) Potential to privatise WTP. We will not rule this out as Wing Tai Holdings has privatised 66.13%-owned Wing Tai Malaysia, while WINGTA holds sufficient cash (S$1.0bn) and WTP trades at 0.3 times Price to Book.
Source: OCBC Treasury Research & Strategy
Source: OCBC Treasury Research & Strategy
Important Information
The information provided herein is intended for general circulation and/or discussion purposes only. It does not take into account the specific investment objectives, financial situation or particular needs of any particular person.
Please seek advice from a financial adviser regarding the suitability of any investment product taking into account your specific investment objectives, financial situation or particular needs before you make a commitment to purchase the investment product. In the event that you choose not to seek advice from a financial adviser, you should consider whether the product in question is suitable for you.
The Bank, its related companies, their respective directors and/or employees (collectively “Related Persons”) may or might have in the future interests in the investment products or the issuers mentioned herein. Such interests include effecting transactions in such investment products, and providing broking, investment banking and other financial services to such issuers. The Bank and its Related Persons may also be related to, and receive fees from, providers of such investment products.
The information in this document is not intended to constitute research analysis or recommendation and should not be treated as such.
This does not constitute an offer or solicitation to buy or sell or subscribe for any security or financial instrument or to enter into a transaction or to participate in any particular trading or investment strategy.
Any opinions or views of third parties expressed in this material are those of the third parties identified, and not those of OCBC Group.
OCBC Group does not guarantee the accuracy of the information provided herein at any time. All of the information provided herein may change any time without notice. You should not make any decisions without verifying its content. OCBC Group shall not be responsible for any loss or damage whatsoever arising directly or indirectly howsoever as a result of any person acting on any information provided herein.
The information provided herein may contain projections or other forward looking statement regarding future events or future performance of countries, assets, markets or companies. Actual events or results may differ materially. Past performance figures are not necessarily indicative of future or likely performance.
The contents hereof are considered proprietary information and may not be reproduced or disseminated in whole or in part without OCBC Bank’s written consent.
Cross-Border Marketing Disclaimer1. Hong Kong SAR: Oversea-Chinese Banking Corporation Limited (“OCBC Bank”) is an Authorized Institution as defined in the Banking Ordinance of Hong Kong (Cap 155), regulated by the Hong Kong Monetary Authority in Hong Kong. This document is for information only and is not intended for anyone other than the recipient. It has not been reviewed by any regulatory authority in Hong Kong. It is not an offer or a solicitation to deal in any of the financial products referred to herein or to enter into any legal relations, nor an advice or a recommendation with respect to such financial products. It does not have regard to the specific investment objectives, financial situation and the particular needs of any recipient or Investor. This document may not be published, circulated, reproduced or distributed in whole or in part to any other person without the Bank’s prior written consent. This document is not intended for distribution to, publication or use by any person in any jurisdiction outside Hong Kong, or such other jurisdiction as the Bank may determine in its absolute discretion, where such distribution, publication or use would be contrary to applicable law or would subject the Bank and its related corporations, connected persons, associated persons and/or affiliates to any registration, licensing or other requirements within such jurisdiction.
2. Indonesia: The offering of the investment product in reliance of this document is not registered under the Indonesian Capital Market Law and its implementing regulations, and is not intended to constitute a public offering of securities under the Indonesian Capital Market Law and its implementing regulations. According, this investment product may not be offered or sold, directly or indirectly, within Indonesia or to citizens (wherever they are domiciled or located), entities or residents, in any manner which constitutes a public offering of securities under the Indonesian Capital Market Law and its implementing regulations.
3. Japan: The information contained in this document is for general reference purposes only. It does not have regard to your specific investment objectives, financial situation, risk tolerance and particular needs. Nothing in this document constitutes an offer to buy or sell or an invitation to offer to buy or sell or a recommendation or a solicitation to buy or sell any securities or investment. We do not have any intention of conducting regulated business in Japan. You acknowledge that nothing in this document constitutes investment or financial advice or any advice of any nature.
4. Malaysia: OCBC Bank does not hold any licence, registration or approval to carry on any regulated business in Malaysia (including but not limited to any businesses regulated under the Capital Markets & Services Act 2007 of Malaysia), nor does it hold itself out as carrying on or purport to carry on any such business in Malaysia. Any services provided by OCBC Bank to residents of Malaysia are provided solely on an offshore basis from outside Malaysia, either as a result of “reverse enquiry” on the part of the Malaysian residents or where OCBC Bank has been retained outside Malaysia to provide such services. As an integral part of the provision of such services from outside Malaysia, OCBC Bank may from time to time make available to such residents documents and information making reference to capital markets products (for example, in connection with the provision of fund management or investment advisory services outside of Malaysia). Nothing in such documents or information is intended to be construed as or constitute the making available of, or an offer or invitation to subscribe for or purchase any such capital markets product.
5. Myanmar: The relevant Bank entities do not hold any licence or registration under the FIML or other Myanmar legislation to carry on, nor do they purport to carry on, any regulated activity in Myanmar. All activities relating to the client are conducted strictly on an offshore basis. The customers shall ensure that it is their responsibility to comply with all applicable local laws before entering into discussion or contracts with the Bank.
6. Oman: This document does not constitute a public offer of investment, securities or financial services in the Sultanate of Oman, as contemplated by the Commercial Companies Law of Oman (Royal Decree No. 4/1974), Banking Law of Oman (Royal Decree No. 114/2000) or the Capital Market Law of Oman (Royal Decree No. 80/1998) and the Executive Regulations of the Capital Market Law (Ministerial Decision No. 1/2009) or an offer to sell or the solicitation of any offer to buy non-Omani investment products, securities or financial services and products in the Sultanate of Oman. This document is strictly private and confidential. It is being provided to a limited number of sophisticated investors solely to enable them to decide whether or not to make an offer to invest in financial products mentioned in this document, outside of the Sultanate of Oman, upon the terms and subject to the restrictions set out herein and may not be reproduced or used for any other purpose or provided to any person other than the original recipient. Additionally, this document is not intended to lead to the making of any contract within the territory or under the laws of the Sultanate of Oman. The Capital Market Authority of Oman and the Central Bank of Oman take no responsibility for the accuracy of the statements and information contained in this document or for the performance of the financial products mentioned in this document nor shall they have any liability to any person for damage or loss resulting from reliance on any statement or information contained herein.
7. South Korea: The document does not constitute an offer, solicitation or investment advertisement to trade in the investment product referred to in the document.
8. Taiwan: The provision of the information and the offer of the service concerned herewith have not been and will not be registered with the Financial Supervisory Commission of Taiwan pursuant to relevant laws and regulations of Taiwan and may not be provided or offered in Taiwan or in circumstances which requires a prior registration or approval of the Financial Supervisory Commission of Taiwan. No person or entity in Taiwan has been authorised to provide the information and to offer the service in Taiwan.
9. Thailand: Please note that neither OCBC Bank nor any other entities in the OCBC Bank’s group maintains any licences, authorisations or registrations in Thailand nor is any of the material and information contained, or the relevant securities or products specified herein approved or registered in Thailand. Interests in the relevant securities or products may not be offered or sold within Thailand. The attached information has been provided at your request for informational purposes only and shall not be copied or redistributed to any other person without the prior consent of OCBC Bank or its relevant entities and in no way constitutes an offer, solicitation, advertisement or advice of, or in relation to, the relevant securities or products by OCBC Bank or any other entities in OCBC Bank’s group in Thailand.
10. The Philippines: The information contained in this document is not intended to constitute a public offering of securities under the Securities Regulation Code of the Philippines.
11. Dubai/U.A.E: This material is communicated by OCBC Bank. OCBC Bank is not a financial institution licensed in the United Arab Emirates and does not undertake banking or financial activities in the United Arab Emirates nor is it licensed to do so. This material is provided for information purposes only and is not financial advice or a financial promotion, nor is it intended to influence an investor's decision to invest. It is not to be construed as an offer to buy or sell or solicitation of an offer to buy or sell any financial instruments or to participate in any particular trading strategy in any jurisdiction. The material is only intended for persons who fulfil the criteria to be classified as "deemed Professional Clients" as defined under the DFSA rules.
12. United Kingdom: The OCBC Bank is authorised and regulated in Singapore by the Monetary Authority of Singapore. The OCBC Bank is not authorised in the United Kingdom by the Financial Conduct Authority for the conduct of investment business. The services provided by the OCBC Bank are not covered by the UK’s Financial Services Compensation Scheme and neither the Prudential Regulation Authority nor the Financial Conduct Authority supervises or regulates the products or services provided by the OCBC Bank to UK residents.
13. United States of America: This product may not be sold or offered within the United States or to U.S. persons.
© Copyright 2017 - OCBC Bank | All Rights Reserved. Co. Reg. No.: 193200032W
 top-bonds.html


