OCBC Group Third Quarter 2026 Net Profit at S$2.04 billion
OCBC Group Third Quarter 2026 Net Profit at S$2.04 billion
Nine-month Group net profit up 10% to a record S$6.24 billion
Singapore, 6 November 2026 – Oversea-Chinese Banking Corporation Limited (“OCBC”) reported a record net profit of S$6.24 billion for the first nine months of 2026 (“9M26”), 10% higher than a year ago (“9M25”). 9M26 total income reached a new high, driven by broad-based growth across Wealth Management (“WM”), Wholesale Banking and Insurance. 9M26 WM fees rose 25% to a record S$1.33 billion and non-interest income from Wholesale Banking grew 24%.
Group net profit for the third quarter (“3Q26”) was S$2.04 billion, up 3% year-on-year. OCBC delivered record Banking Operations profit for 3Q26, supported by its strong franchise, and disciplined cost and risk management. Great Eastern Holdings (“GEH”) underlying business remained resilient, with New Business Embedded Value (“NBEV”) up 14% for 3Q26. Quarter-on-quarter, Group net profit was down 8%, as record Banking Operations profit was offset by weaker investment performance from GEH.
Net interest income (“NII”) was higher quarter-on-quarter in 3Q26, lifted by loan growth and improved yields, partly offset by higher funding costs. Higher SORA rates were a net positive to NII as asset yields rose faster than funding costs, while the rise in US rates pressured margins this quarter as funding repriced faster than assets. The benefits from higher US rates would be reflected in the coming quarters as assets reprice. The Group’s WM franchise remained strong. Banking WM AUM continued to grow, with 3Q26 WM fees above the strong 3Q25 results although below the record high in 2Q26.
Asset quality stayed strong, with improved NPL ratio of 0.8% and lower allowances, reflecting continued prudent risk management. The Group maintained sufficient buffers against potential risks with an NPA coverage ratio at 168%. Capital remained sound and well positioned to support business growth. Balance sheet management initiatives this quarter further enhanced capital efficiency, with scope for continued progress.
3Q26 Quarter-on-Quarter Performance
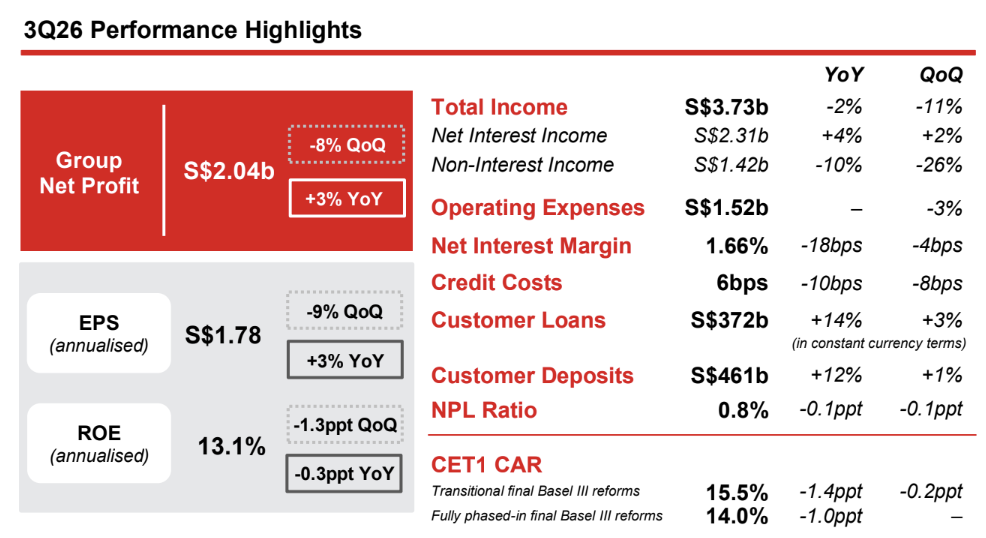
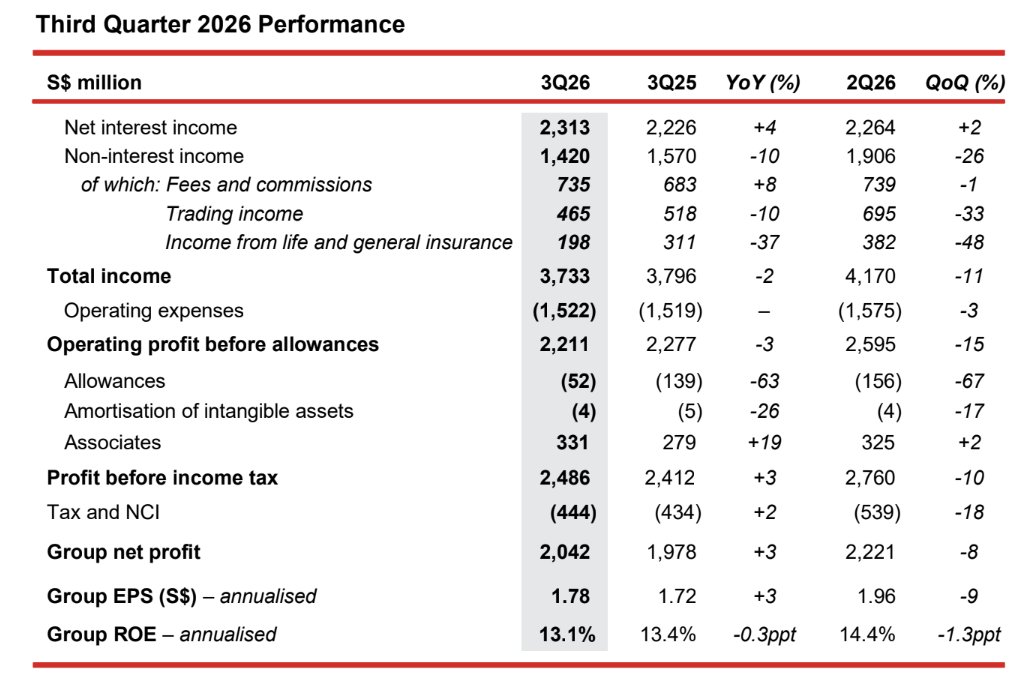
Group net profit for 3Q26 was S$2.04 billion, 8% below the record level in 2Q26, mainly due to GEH’s weaker investment performance in insurance and shareholders’ funds. Banking Operations profit rose 8% to a record S$1.90 billion in 3Q26, supported by loan growth, continued momentum in customer flow trading income and resilient fees.
- NII rose 2% to S$2.31 billion, supported by a 3% growth in average assets and higher yields, partly offset by a rise in funding costs, particularly from the rise in US rates.
- Non-interest income was S$1.42 billion, down 26% from 2Q26, impacted by GEH’s investment performance. Customer-driven income, particularly fees and customer flow trading income, remained strong.
- Net fees of S$735 million were comparable to the record 2Q26 level, despite more challenging market conditions. Customer flow trading income rose to a record S$480 million driven by growth across all segments, in particular corporates, reflecting the structural strength of our franchise.
- Trading income declined 33% from a high base in 2Q26 despite the record customer flow income in 3Q26. This was mainly due to mark-to-market losses on GEH’s bond portfolio in its shareholders’ fund amid rising interest rates in 3Q26, as well as the absence of significant gains on its equity portfolio in 2Q26 that were not repeated this quarter.
- GEH’s insurance income fell 48% from a quarter ago, reflecting market-driven valuation losses arising from interest rate movements. GEH’s underlying business remained strong. NBEV was slightly below the high base in 2Q26 while margins improved to 57.5% from 51.0% in the previous quarter due to a more favourable product mix.
- The Group’s WM income, comprising income from private banking, premier private client, premier banking, insurance, asset management and stockbroking, declined 25% due to weaker investment performance from GEH. Excluding GEH, Banking WM income rose 2% to a record high of S$1.12 billion. Banking WM AUM grew 2% to a new high of S$358 billion, with continued net new money inflows from all wealth segments.
- Operating expenses were 3% lower, while cost-to-income (“CIR”) was 40.8% compared to 37.8% in the previous quarter.
- Total allowances were lower at S$52 million, mainly from a decline in allowances for impaired assets. Credit costs were at 6 basis points on an annualised basis, compared to 14 basis points in 2Q26.
- Share of results of associates rose 2% to S$331 million.
- The Group’s ROE for 3Q26 was 13.1% while EPS was S$1.78, on an annualised basis.
3Q26 Year-on-Year Performance
- Group net profit rose 3% from the previous year, despite lower profit contribution from GEH.
- NII was 4% higher than a year ago, supported by a 15% growth in average assets, from an increase in both customer loans and high-quality non-commercial assets. This was partly offset by an 18-basis-point contraction in net interest margin (“NIM”) in a lower interest rate environment.
- Fee income rose 8% year-on-year, driven by broad-based fee growth, particularly from wealth, loan and trade-related, as well as investment banking activities.
- Trading and insurance income declined 10% and 37% respectively, mainly reflecting GEH’s weaker investment performance. NBEV and margins continued to grow with favourable product mix.
- Operating expenses were unchanged year-on-year. CIR was 40.8%, compared to 40.0% a year ago.
- Total allowances were lower year-on-year, mainly from a decline in allowances for impaired assets.
- Share of results of associates increased 19% to S$331 million.
9M26 Year-on-Year Performance
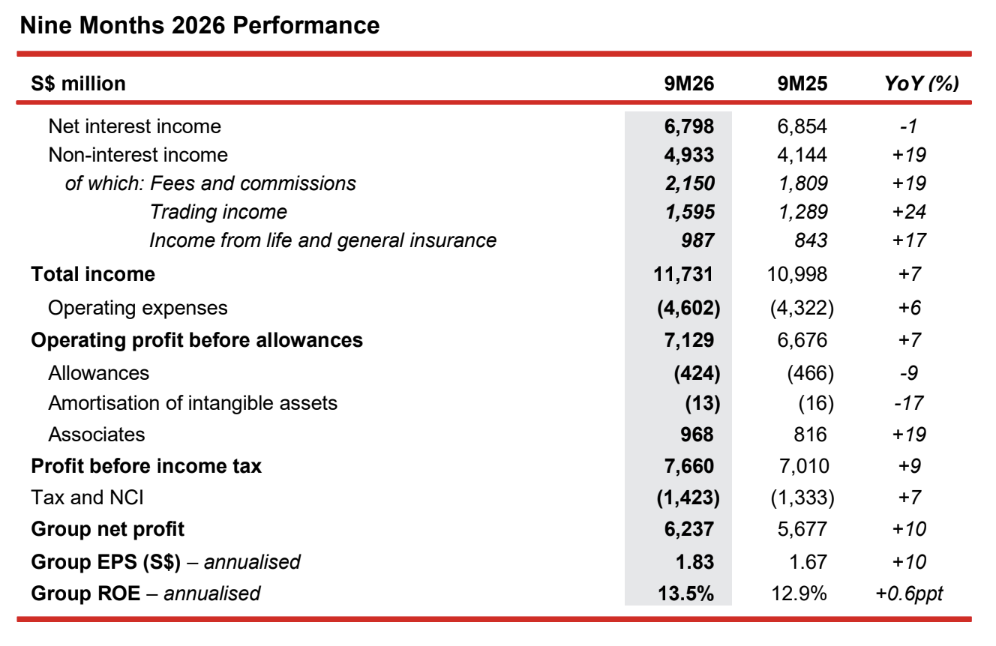
Group net profit rose 10% from a year ago to a record S$6.24 billion.
- NII was S$6.80 billion, down slightly by 1%, as a 12% growth in average assets supported NII amid a lower interest rate environment. NIM was 1.71%, down 22 basis points from 1.93% in 9M25.
- Non-interest income grew 19% to a new high of S$4.93 billion, driven by broad-based growth across fee, trading and insurance income. Strong growth in non-interest income raised its contribution to total income to 42% in 9M26, up from 38% in the previous year.
- Net fee income rose 19% to S$2.15 billion, boosted by strong wealth, loan and trade-related and investment banking fees. Wealth fees grew 25%, driven by broad-based growth across all product channels, and accounted for 62% of total fee income.
- Trading income grew 24% from a year ago, as customer flow income rose 40% to a record S$1.35 billion, driven by strong traction in wealth-related and corporate hedging activities. This was partly offset by lower investment income from GEH amid less favourable market conditions.
- Insurance income increased 17%, underscored by strong underlying insurance business, partly offset by lower investment income. Total weighted new sales (“TWNS”) and NBEV grew 9% and 23% respectively, driven by stronger sales and more favourable product mix. NBEV margin widened to 52.2%, from 46.1% a year ago.
- Operating expenses rose 6% to S$4.60 billion from a year ago. The increase was mainly from a rise in variable compensation in line with income growth, and higher IT-related and promotional expenses to support business growth.
- Total allowances of S$424 million were 9% lower than the previous year, mainly from lower allowances for impaired assets.
- Share of results of associates increased 19% to S$968 million from S$816 million a year ago.
- The Group’s annualised ROE was 13.5%, up from 12.9% in the previous year, while EPS increased 10% to S$1.83.
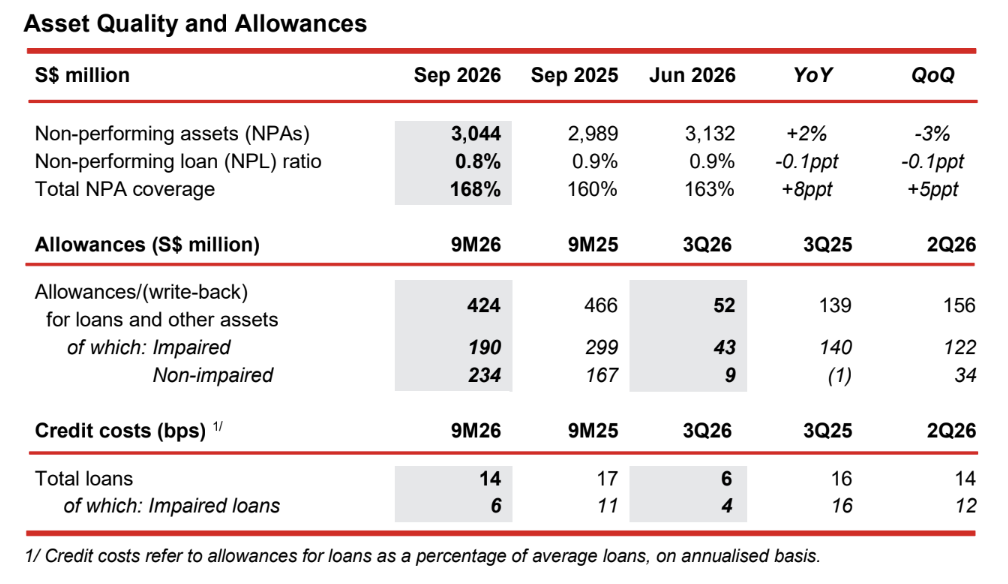
Non-performing assets (“NPAs”)
- NPAs were S$3.04 billion as at 30 September 2026, down 3% from 2Q26 and up 2% year-on-year.
- NPAs declined from the previous quarter, as recoveries and upgrades more than offset benign corporate NPA formation.
- NPL ratio was lower at 0.8%, and total NPA coverage was at 168%.
Allowances
- For 9M26, total allowances declined 9% to S$424 million and comprised:
- Allowances for impaired assets of S$190 million, below S$299 million in 9M25.
- Allowances for non-impaired assets of S$234 million, which mainly comprised overlays for macroeconomic uncertainties, including Middle East conflicts and Indonesia, prudently set aside in the first half of the year.
- 3Q26 allowances of S$52 million were lower quarter-on-quarter and year-on-year, mainly from a decline in allowances for impaired assets.
- 9M26 total credit costs were lower at 14 basis points on annualised basis, compared to 17 basis points a year ago, reflecting the Group’s continuous prudent risk management.
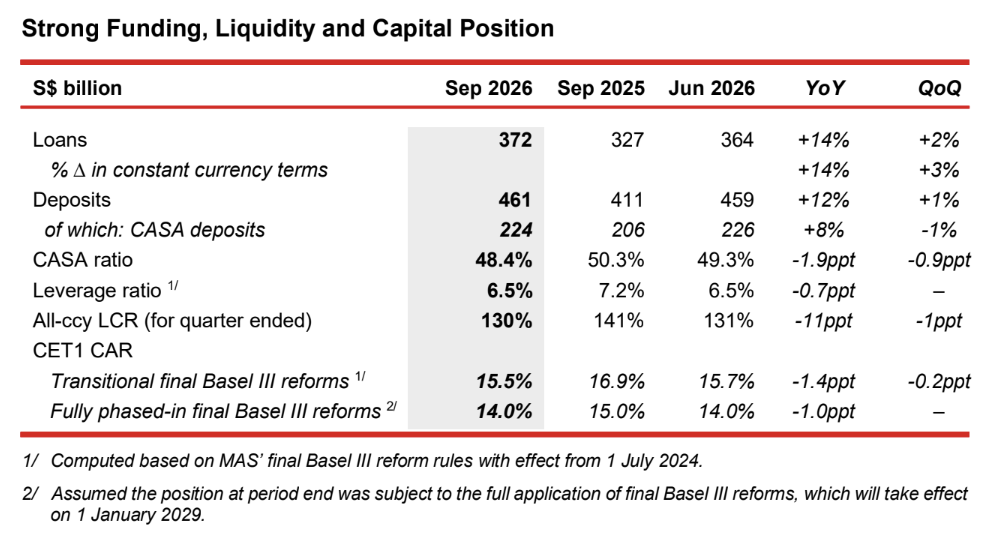
- Customer loans were S$372 billion as at 30 September 2026, up 14% from the previous year and 3% higher than a quarter ago, on a constant currency basis.
- The year-on-year loan growth was broad-based across geographies and industries, led by high growth sectors including TMT, digital infrastructure, transportation and power & utilities, and real estate in the developed markets, as well as consumer wealth and Singapore mortgage loans.
- Sustainable financing loans increased 13% from a year ago to S$62.0 billion as at 30 September 2026, and accounted for 17% of total customer loans; total commitments reached S$86.0 billion.
- Customer deposits rose 12% year-on-year to S$461 billion, driven by growth in both CASA deposits and fixed deposits. CASA ratio was 48.4% as at 30 September 2026.
- Loans-to-deposits ratio was 79.5%, higher compared to 78.4% as at 30 June 2026.
- The Group is subject to MAS’ final Basel III reforms requirements which came into effect on 1 July 2024, and are being progressively phased in between 1 July 2024 and 1 January 2029. Group CET1 CAR as at 30 September 2026 was 15.5%, and on a fully phased-in basis, it was 14.0%.
Message from Group CEO, Tan Teck Long
“Our strong third quarter 2026 results reflected our franchise strength and resiliency, with Group net profit rising 3% year-on-year to S$2.04 billion. This beat 3Q25, the strongest quarter last year. Banking operations total income and net profit rose 7% and 16% year-on-year to record highs. This was underpinned by strong performance across our Wealth Management and Wholesale Banking businesses as we continued to execute our Next Frontier strategy. Great Eastern’s underlying insurance business remained resilient. New business embedded value grew 14% year-on-year, driven by more than 20% growth in its agency and bancassurance channels in Singapore, even though profit contribution was lower from weaker investment performance in its insurance and shareholders’ funds.
Net interest income grew 4% year-on-year to S$2.31 billion, the highest over six quarters. We achieved 13% growth in non-interest income from Banking operations, anchored by strong growth in wholesale banking and wealth management fees. Customer flow trading income rose 29% to an all-time high.
Even as customer loans grew 14% year-on-year, asset quality remained sound, with our NPL ratio improving to 0.8%.
Great Eastern’s profit was weighed down by mark-to-market losses on its bond portfolios amid rising interest rates in 3Q26, and the absence of significant gains on its equity portfolio in 2Q26 that were not repeated this quarter. For the nine-month period, Great Eastern’s profit contribution rose 5% year-on-year to S$941 million.
Looking ahead, global conditions remain uncertain amid geopolitical tensions and elevated inflation risks. Much of the near-term outlook will depend on the easing of energy prices brought about by the war in the Middle East, while the market conditions in Indonesia are also being closely monitored. Meanwhile, AI and related technology sectors continue to register strong growth.
With our strong capital, funding and liquidity position, diversified income streams and disciplined risk management, we are well positioned to navigate uncertainties and tap the growth sectors to deliver sustainable long-term value.”