A tale of two REIT markets
A tale of two REIT markets
By Andy Wong, Senior Equity Research Analyst, OCBC
Singapore, 21 August 2026 – When investors think about real estate, interest rates are usually the first thing that comes to mind. After all, real estate is capital intensive and often financed with leverage, so the cost of capital matters. However, REIT performance is influenced by more than just interest rates.
Demand and supply dynamics, which drive rental and occupancy outlook, can diverge sharply across asset classes and geographies. As a result, REIT markets can experience markedly different outcomes even under similar interest rate conditions.
The divergence has been particularly evident in 2026. Looking at performance on a total returns basis ytd, US-listed REITs (US REITs), as represented by the MSCI US REIT Index, have achieved a total return of 19.7% as at August 14, comfortably ahead of the S&P500 Index’s 14.5% return.
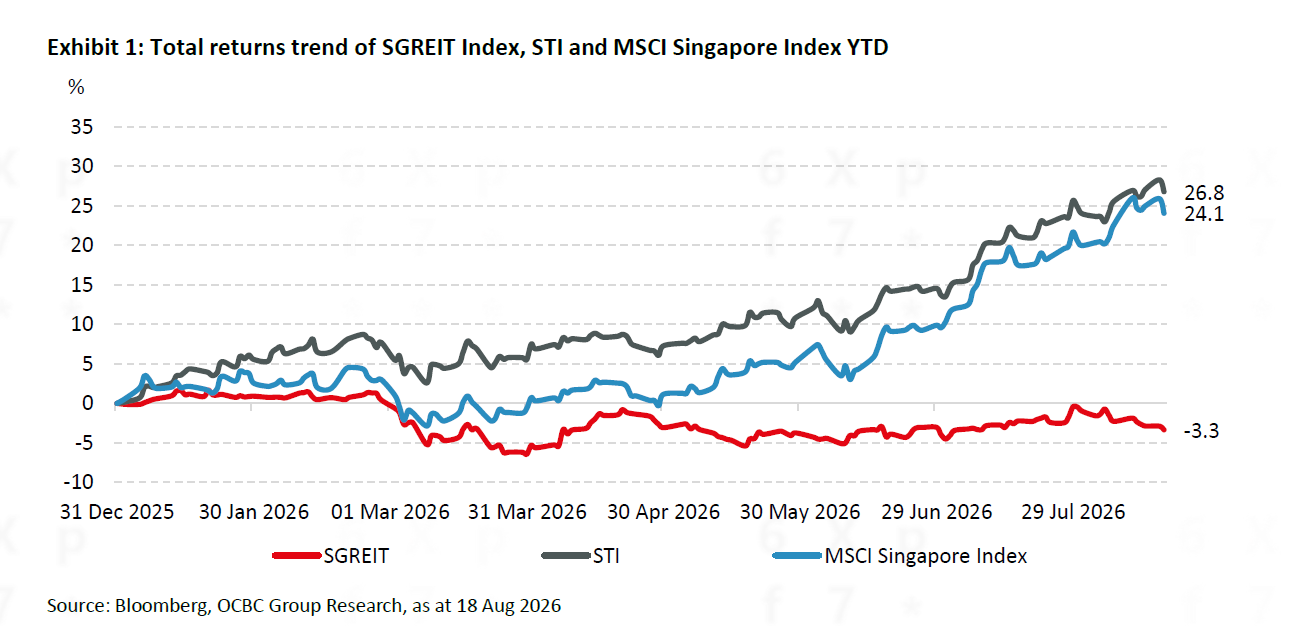
In contrast, Singapore-listed REITs (S-REITs), using the iEdge S-REIT Index as benchmark, recorded a lacklustre total return of -2.9% over the same period. This represented an underperformance compared to the Straits Times Index’s strong total return of 27.1%.
Why has there been such a stark difference between the share price performance of S-REITs and US REITs?
Capital management
One explanation lies in capital management. S-REITs under our coverage have largely been prudent in their capital management, with 72.5% of borrowings on fixed or hedged rates as at June 30. However, that is still considerably lower than US REITs, which had 89.3% of debt on fixed rates as at March 31. In an environment where long-end yields have risen, and market concerns over potential rate hikes have increased, a higher hedging ratio offers investors more comfort from a risk management perspective.
The starting point and sector composition
Another possible explanation relates to where each market began the year. The MSCI US REIT Index was the laggard among the major REIT markets we track in 2025, delivering a total return of just 2.9%, against 16.4% for the iEdge S-REIT Index. This lower starting base partly contributed to the stronger rebound witnessed this year.
Sector composition has also helped. While artificial intelligence (AI) continues to dominate headlines, investors have increasingly rotated into more defensive sectors of late. Healthcare REITs in the US, which carry the largest sectoral weight in the MSCI US REIT Index at 21.4% as at July 31, have benefited from this shift.
At the same time, although AI-related stocks have seen significant volatility ytd, data centre REITs such as Equinix and Digital Realty Trust have strongly outperformed both the MSCI US REIT Index and S&P 500 Index. Both are clear beneficiaries of the AI data centre buildout, and business momentum is gaining traction. Equinix recently raised its FY2026 revenue growth guidance by 1 percentage point (ppt) from 10%-11% to 11%-12% and also lifted its FY2027-FY2029 revenue growth outlook materially, from 7%-10% to 10%-13%. Management highlighted during its 2QFY2026 earnings call that stronger expected demand is coming from the world’s largest enterprises that are modernising their on-premises infrastructure. Together, data centre REITs represented 12.2% of the MSCI US REIT Index weight.
Retail and hospitality REITs have re-rated as well, underpinned by World Cup tailwinds that drew strong tourist arrivals and boosted revenue per available room (RevPAR) and consumer spending. With the conclusion of this major sporting event, business conditions are likely to normalise, and investor sentiment could cool along with them.
Earnings and fund flows
Given the MSCI US REIT Index’s heavier exposure to growth sectors, it is not surprising that key growth metrics have outpaced those of S-REITs. US REIT investors typically focus on funds from operations (FFO) or adjusted funds from operations (AFFO) as key financial metrics rather than dividends. This is because FFO and AFFO allow for greater comparability across the sector and provide a better measure of earnings sustainability, coupled with the fact that US REITs undertake more development projects as compared to S-REITs.
According to data from The National Association of Real Estate Investment Trusts (Nareit), FFO per share of US equity REITs jumped 12.3% y-o-y in 1Q2026 (data for 2Q26 was not available at the time of writing), a strong improvement against the 5.3% y-o-y decline in 4Q2025.
For S-REITs under our coverage, distribution per unit (DPU) grew 4% y-o-y on average in the 2Q2026 reporting period, although median growth was softer at +0.5% y-o-y.
Fund flows tell a similar story. Based on Bloomberg data, major US REIT exchange-traded funds (ETFs) such as Vanguard Real Estate ETF, Schwab US REIT ETF and iShares Core US REIT ETF attracted fund inflows of US$3.4 billion ($4.34 billion) ytd. In Singapore, fund flows data from the Singapore Exchange showed that institutional investors have been net sellers of S-REITs ytd, with $1.1 billion of net selling recorded from the week of Jan 5 to the week of Aug 3. This positioning on S-REITs has persisted for some time, as evidenced by $1.3 billion and $1.6 billion of net outflows in 2025 and 2024, respectively. Retail investors have consistently taken the other side, with net inflows of $1.6 billion in 2024, $0.9 billion in 2025 and $1.1 billion ytd in 2026.
How income-seeking investors should position their investments
Does this mean that income-seeking investors should turn to US REITs given their strong performance ytd and move away completely from S-REITs? We do not think so. Factors such as valuation, dividend yields, taxation and currency risks should also be considered.
For Singaporean investors seeking income, the MSCI US REIT Index is currently trading at a forward 12-month dividend yield of 3.68% as at Aug 14, according to Bloomberg data. This is 0.8 standard deviations (s.d.) below its 10-year average of 4.03%, suggesting that valuations are relatively less compelling from an income perspective.
In addition, this yield is before any potential taxes, as non-US residents are subject to a 30% withstanding tax on dividends. The current dividend yield is also below the US 10-year Treasury yield of 4.69%. Beyond yield considerations, Singaporean investors investing in US-listed REITs would also be subject to direct foreign exchange risks.
In contrast, the iEdge S-REIT Index offers a higher distribution yield of 6.30%, which is 0.4 s.d. above its 10-year average of 6.13%. Relative to the Singapore 10-year government bond yield of 2.27%, this translates to a distribution yield spread of 402 basis points (bps). This is slightly above the 10-year average of 391 bps, and 1.1 s.d. above the five-year average of 364 bps.
Against this backdrop and considering OCBC Group Research’s house view that the Federal Reserve will keep its benchmark rate on hold for the remainder of 2026 and through 2027, we believe selective opportunities can still be found in the S-REITs sector. Furthermore, operating metrics of S-REITs remain largely healthy, with the exception of those with sizeable exposure to China, where oversupply challenges persist across various sectors.
We favour S-REITs that can deliver sustainable and resilient growth in core DPU, supported by healthy underlying operational performance and prudent capital management. Rather than chasing headline yields, investors should prioritise REITs with strong balance sheets, financial flexibility and the ability to navigate an evolving interest rate environment.
While diversification across geographies and property sectors remains an important portfolio consideration, our strongest preference continues to be for Singapore-based assets. Singapore’s political stability, transparent regulatory framework and defensive economic characteristics provide a solid foundation for long-term value creation.
In addition, relatively healthy domestic funding conditions position Singapore-focused S-REITs well to manage refinancing needs and inorganic growth opportunities.
This article was first published in The Edge Singapore on 21 August 2026.