OCBC Group Full Year 2025 Net Profit at S$7.42 billion; full year profit before tax up 2% to a new high of S$9.12 billion
OCBC Group Full Year 2025 Net Profit at S$7.42 billion; full year profit before tax up 2% to a new high of S$9.12 billion
Proposed ordinary dividend of 42 cents and special dividend of 16 cents; total dividend payout at 60%
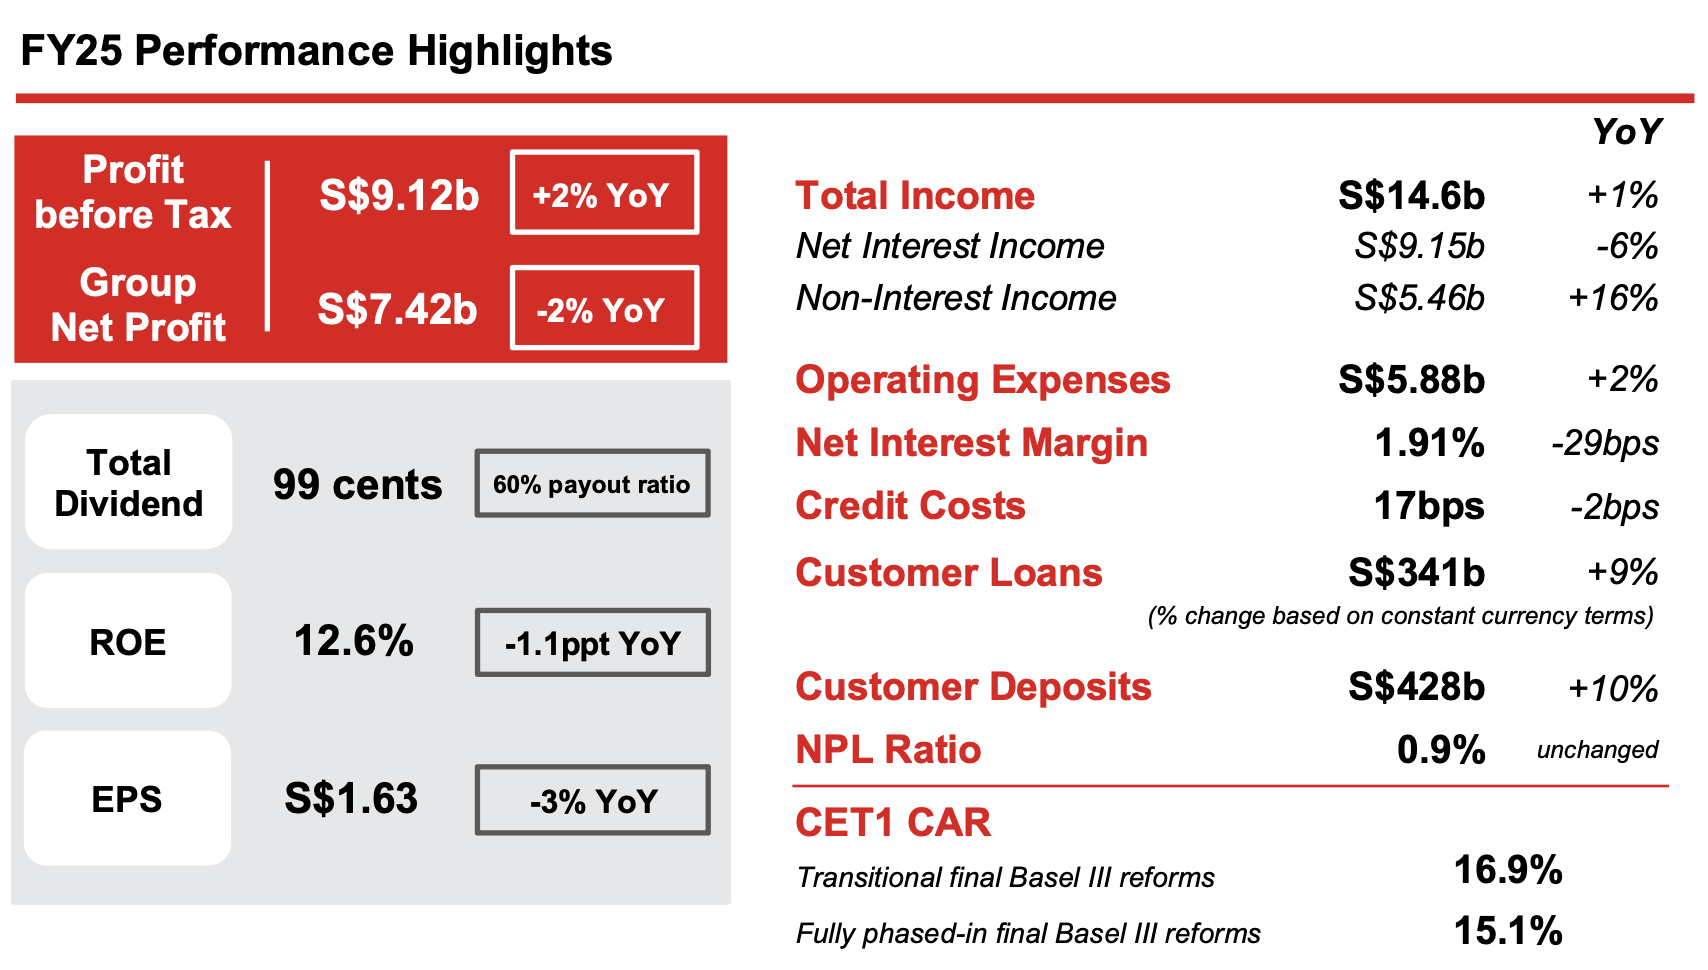
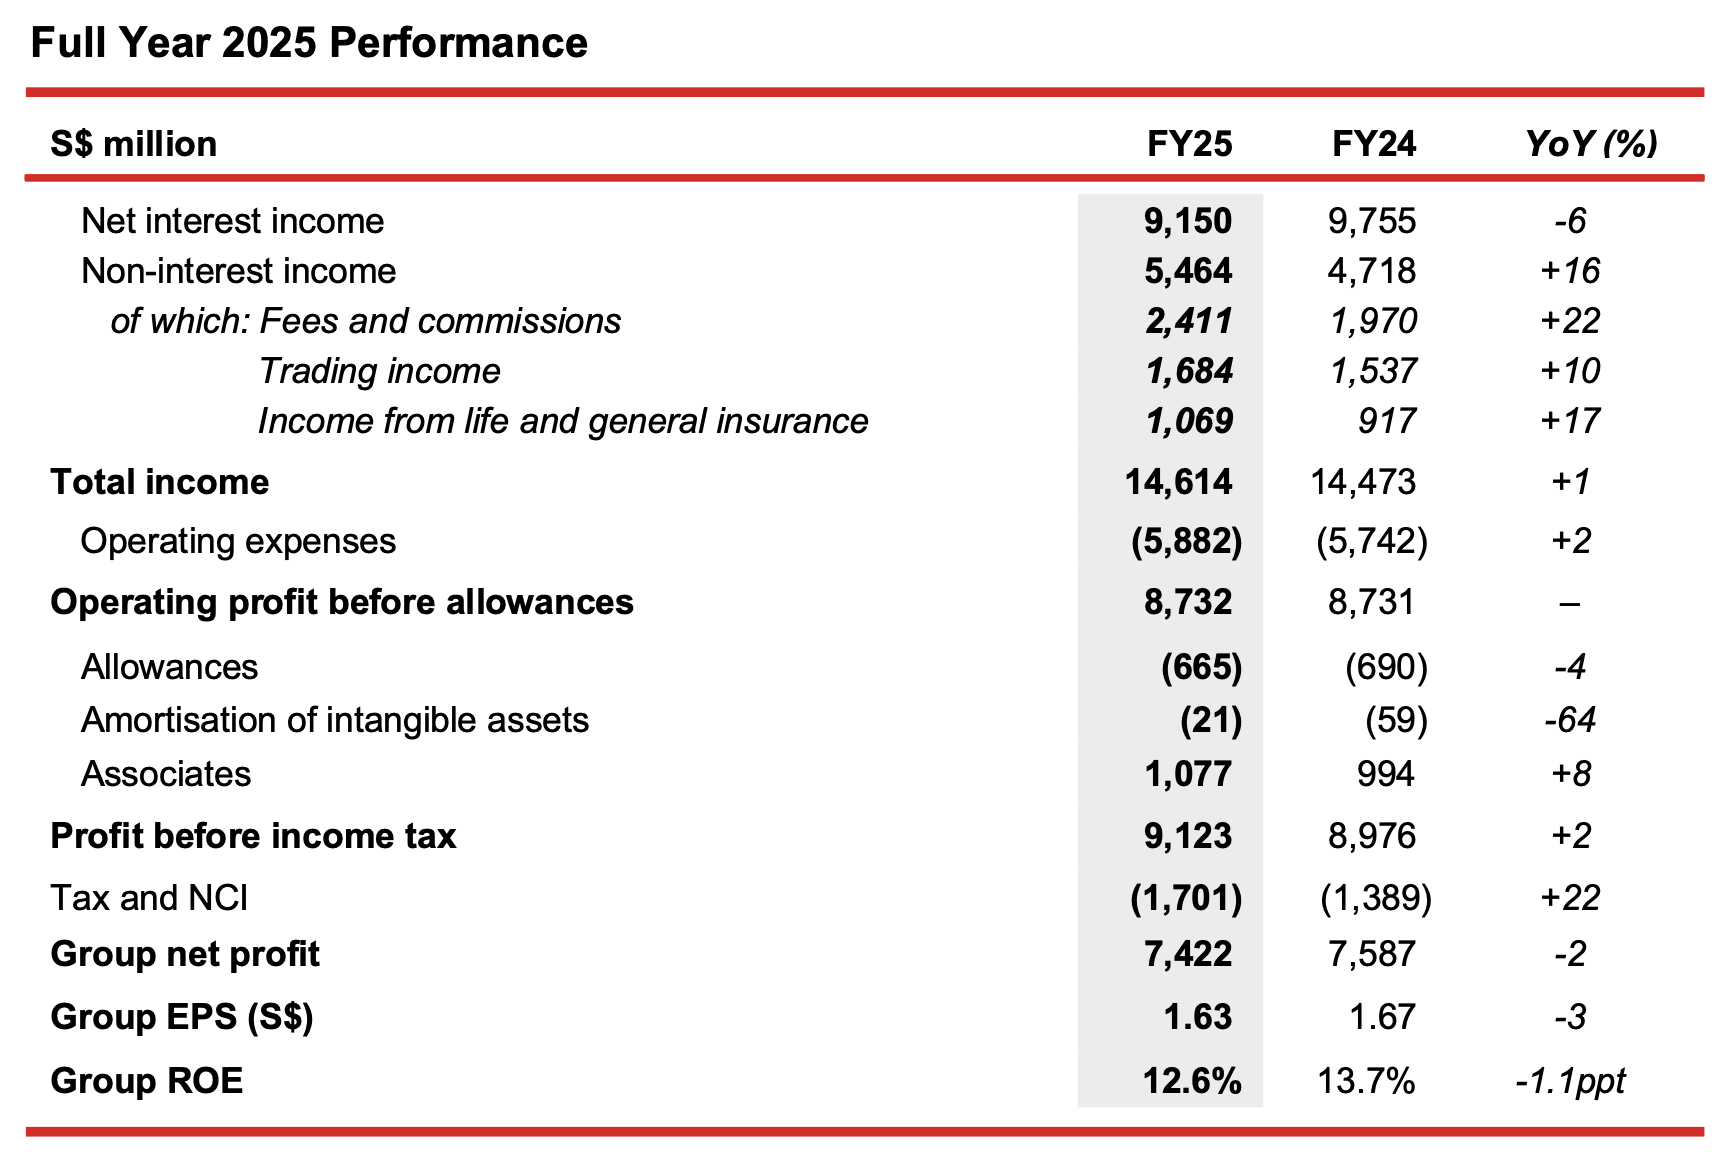
Singapore, 25 February 2026 – Oversea-Chinese Banking Corporation Limited (“OCBC”) reported net profit of S$7.42 billion for the full year of 2025 (“FY25”), which was 2% below the record S$7.59 billion in the previous year (“FY24”). Profit before tax rose 2% to a new high of S$9.12 billion, supported by record total income amid a declining interest rate environment, reflecting the strength of the Group’s diversified income streams. Tax expense was 27% higher mainly due to increased profit contribution from higher tax jurisdictions, and implementation of the Base Erosion and Profit Shifting (“BEPS”) Pillar Two which requires a top-up to 15% minimum global tax for each jurisdiction.
OCBC delivered record income of S$14.6 billion, driven by 16% non-interest income growth, which more than offset the lower net interest income. Operating expenses were well managed with cost-to-income (“CIR”) ratio remaining at 40%, as the Group continued to invest for strategic growth while exercising discipline in discretionary spending. Asset quality continued to be stable with non-performing loan (“NPL”) ratio at 0.9% for the seventh quarter. Total credit costs were lower at 17 basis points, while allowance coverage for non-performing assets stood at 151%.
Supported by the Group’s robust financial performance and in line with the announced S$2.5 billion capital return plan, the Board has proposed a final ordinary dividend of 42 cents and special dividend of 16 cents per share for FY25. Together with the interim dividend of 41 cents declared for the first half of 2025, total dividends for FY25 will amount to 99 cents per share and representing 60% of Group net profit. The capital return plan is targeted to be completed by FY26.
FY25 Year-on-Year Performance
Group net profit was 2% lower at S$7.42 billion. Profit before tax was 2% higher at S$9.12 billion, driven by record income and lower allowances.
- Net interest income was S$9.15 billion, 6% lower than the previous year, as asset yields fell faster than funding costs due to steep declines in key benchmark rates. This was moderated by a 7% growth in average customer loans and an increase in high-quality assets as the Group continued to deploy excess liquidity to income-accretive non-commercial assets.
- Non-interest income rose 16% to S$5.46 billion, driven by double-digit growth across fee, trading and insurance income:
- Net fee income climbed 22% to S$2.41 billion lifted by broad-based growth. Notably, wealth management fees surged 33% with strong contribution across all wealth product channels and regions, in particular Singapore and Hong Kong, and accounted for more than half of net fee income.
- Net trading income rose 10% to S$1.68 billion, from S$1.54 billion a year ago, driven by record customer flow income. The strong growth was contributed by both wealth and corporate segments, with continued momentum in wealth investments and growing demand by corporate customers to hedge against market uncertainties.
- Insurance income from Great Eastern Holdings (“GEH”) grew 17% to S$1.07 billion, driven by strong performance in the underlying insurance business. New business embedded value (“NBEV”) rose 19% to S$740 million, attributed to sustained sales performance and improved product mix, driving improvement in overall NBEV margin to 48.2% compared to 34.6% a year ago.
- The Group’s wealth management (“WM”) income, comprising income from private banking, premier private client, premier banking, insurance, asset management and stockbroking, grew 14% to a record S$5.60 billion, lifted by income growth across the wealth continuum. Group WM income accounted for 38% of total income, a notch higher than prior year’s 34%. Banking WM AUM rose 15% to a new high of S$343 billion, driven by net new money inflows from all wealth segments, as well as positive market valuation.
- Operating expenses were S$5.88 billion, up 2% from a year ago, mainly attributed to higher staff costs and IT-related expenses. The higher staff costs were in line with the growth in variable compensation associated with increased business activities and annual salary increments. Expense growth was well controlled as the Group continued its strategic investments in talent and technology to support growth and raise productivity, while exercising strong discipline in discretionary expenses. CIR was 40.2% for FY25, compared to 39.7% in the previous year.
- Total allowances declined 4% to S$665 million, mainly due to lower allowances for non-impaired assets. Credit costs were lower at 17 basis points of loans, compared to 19 basis points a year ago.
- Share of results of associates rose 8% to S$1.08 billion, from S$994 million in the preceding year.
- The Group’s ROE was lower at 12.6%, while EPS was S$1.63.
4Q25 Year-on-Year Performance
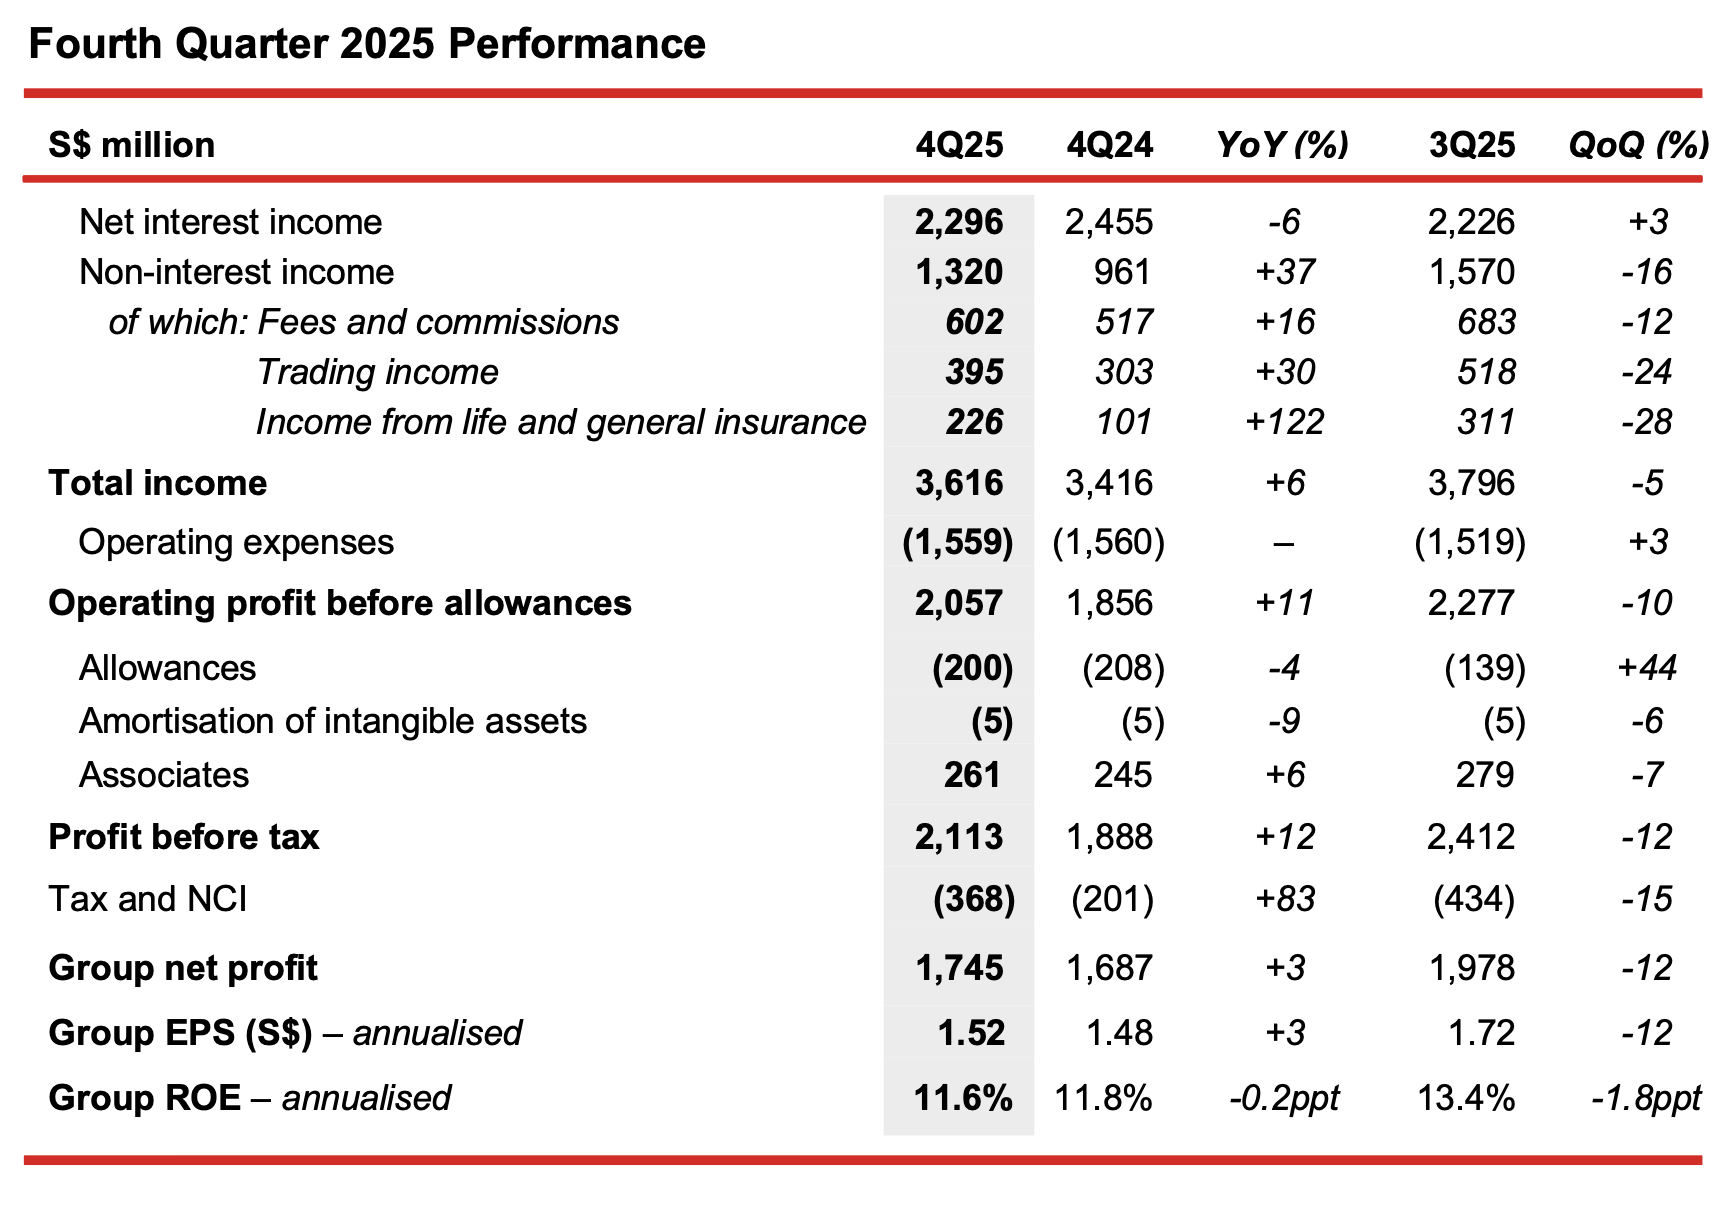
Group net profit rose 3% from a year ago to S$1.74 billion. Profit before tax was 12% higher mainly driven by strong non-interest income growth.
- Net interest income fell 6% from the previous year to S$2.30 billion, as asset yields compressed at a faster pace than deposit costs in a declining interest rate environment. This was partly cushioned by an 8% growth in average assets.
- Non-interest income rose 37% to S$1.32 billion, driven by strong broad-based growth across fee, trading and insurance income:
- Net fee income grew 16% to S$602 million, from S$517 million a year ago, largely driven by a 26% increase in wealth management fees, coupled with higher loan-related, brokerage, fund management and credit card fees.
- Net trading income rose 30% to S$395 million, lifted by higher customer flow income from both wealth and corporate segments.
- Insurance income more than doubled to S$226 million from S$101 million a year ago, driven by improved insurance and investment performance, and in part due to the negative adjustment arising from changes in the medical insurance environment reported in the previous year.
- The Group maintained cost discipline and operating expenses were relatively unchanged from a year ago at S$1.56 billion. CIR was lower at 43.1%, compared to 45.7% last year.
- Total allowances were S$200 million, 4% lower than S$208 million a year ago. Credit costs were at 20 basis points of loans on an annualised basis, compared to 21 basis points in 4Q24.
- Share of results of associates rose 6% to S$261 million, from S$245 million a year ago.
4Q25 Quarter-on-Quarter Performance
Group net profit was 12% below the previous quarter.
- Net interest income grew 3% from a quarter ago to S$2.30 billion, driven by a 2% asset growth, lower funding costs and continued deployment of excess liquidity to high-quality assets.
- Non-interest income was 16% lower at S$1.32 billion, as compared to S$1.57 billion last quarter.
- Wealth management fees and customer flow treasury income were lower, both affected by typical year-end seasonality.
- Insurance income declined 28% mainly due to adjustments to reflect the updated expectations in the medical insurance environment in Malaysia. Underlying business remained strong, as reflected in a 22% increase in total weighted new sales and 32% growth in NBEV from previous quarter.
- Operating expenses increased 3%, mainly from higher technology-related costs and professional fees as the Group continued to invest in strategic initiatives along its digitalisation journey.
- Total allowances of S$200 million were 44% higher than the previous quarter, mainly due to higher allowances for impaired assets, partly offset by a net write-back in allowances for non-impaired assets.
- Share of results of associates was S$261 million, down 7% from S$279 million a quarter ago.
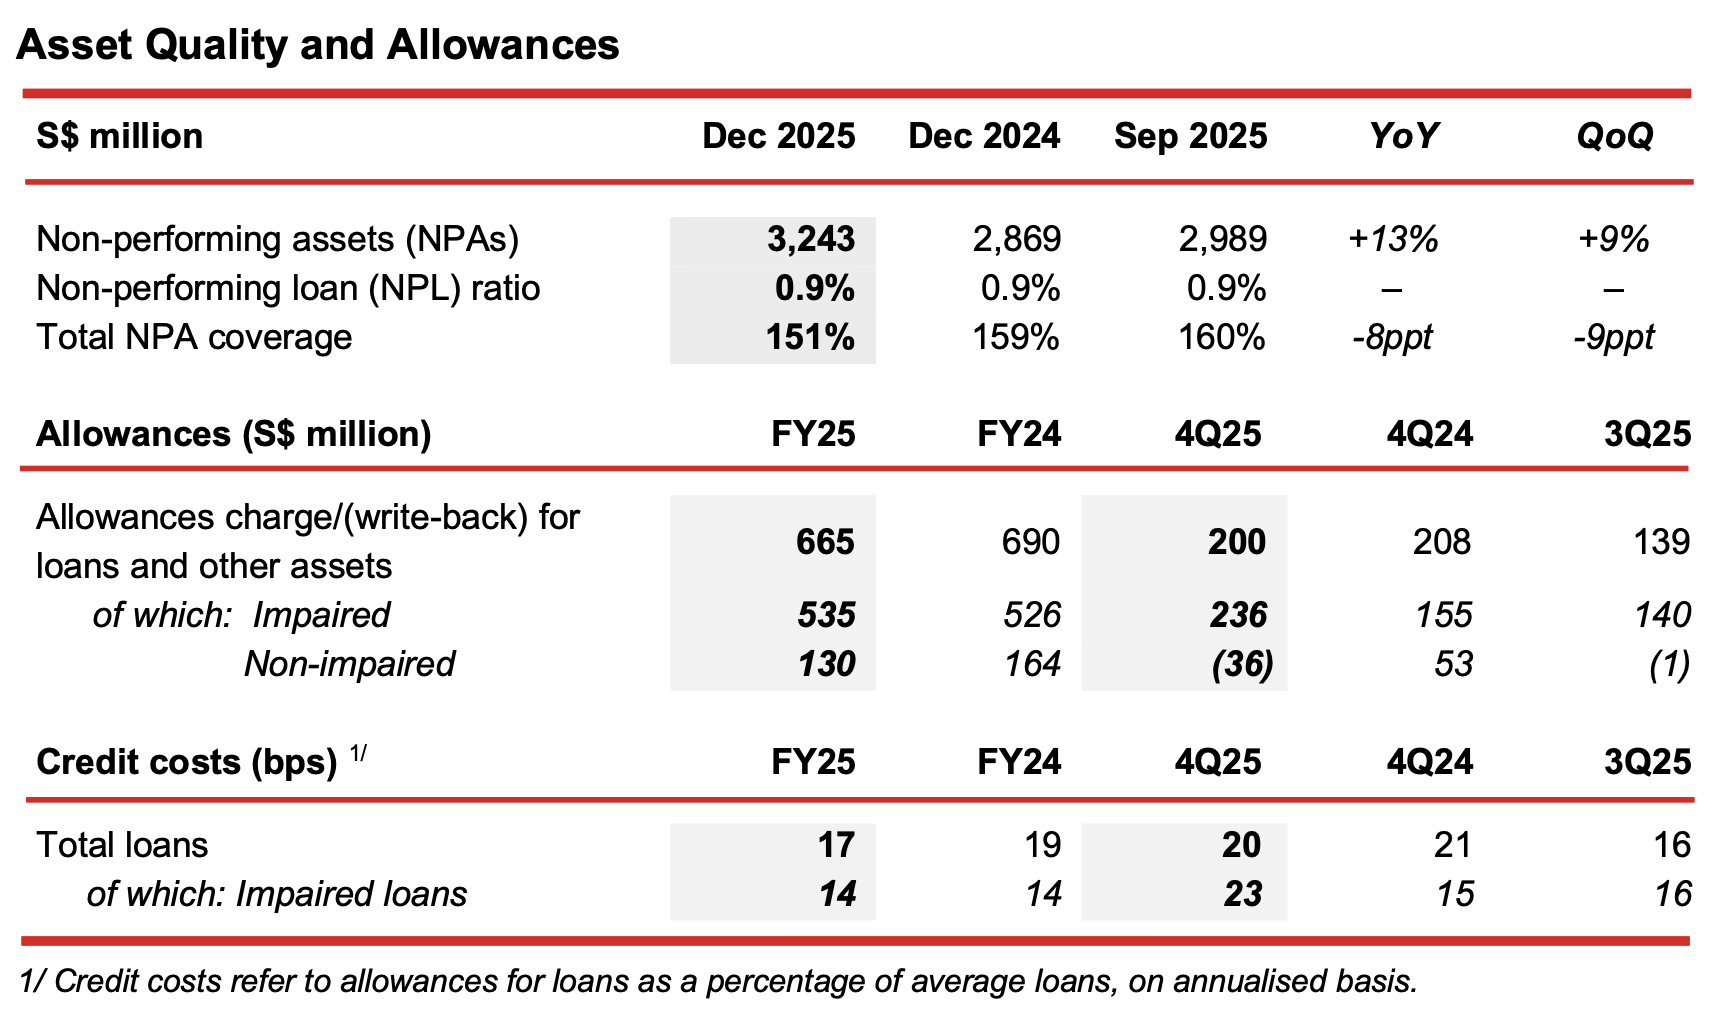
Non-performing assets (“NPAs”)
- As at 31 December 2025, total NPAs were S$3.24 billion, up 13% from a year ago.
- Against the previous quarter, NPAs were 9% higher, mainly due to lower net recoveries, upgrades and write-offs. New corporate NPA formation was relatively stable at S$399 million as compared to S$349 million a quarter ago.
- NPL ratio remained unchanged at 0.9%, and total NPA coverage stood at 151%.
Allowances
- For FY25, total allowances were 4% lower at S$665 million, and credit costs declined to 17 basis points rom 19 basis points a year ago.
- 4Q25 total allowances were S$200 million, and comprised mainly:
- Allowances for impaired assets of S$236 million, set aside largely for two corporate real estate accounts.
- Write-back in allowances for non-impaired assets of S$36 million, primarily due to migration to allowances for impaired assets, and adjustments for changes in macroeconomic variables, partly offset by changes in exposures and risk profiles.
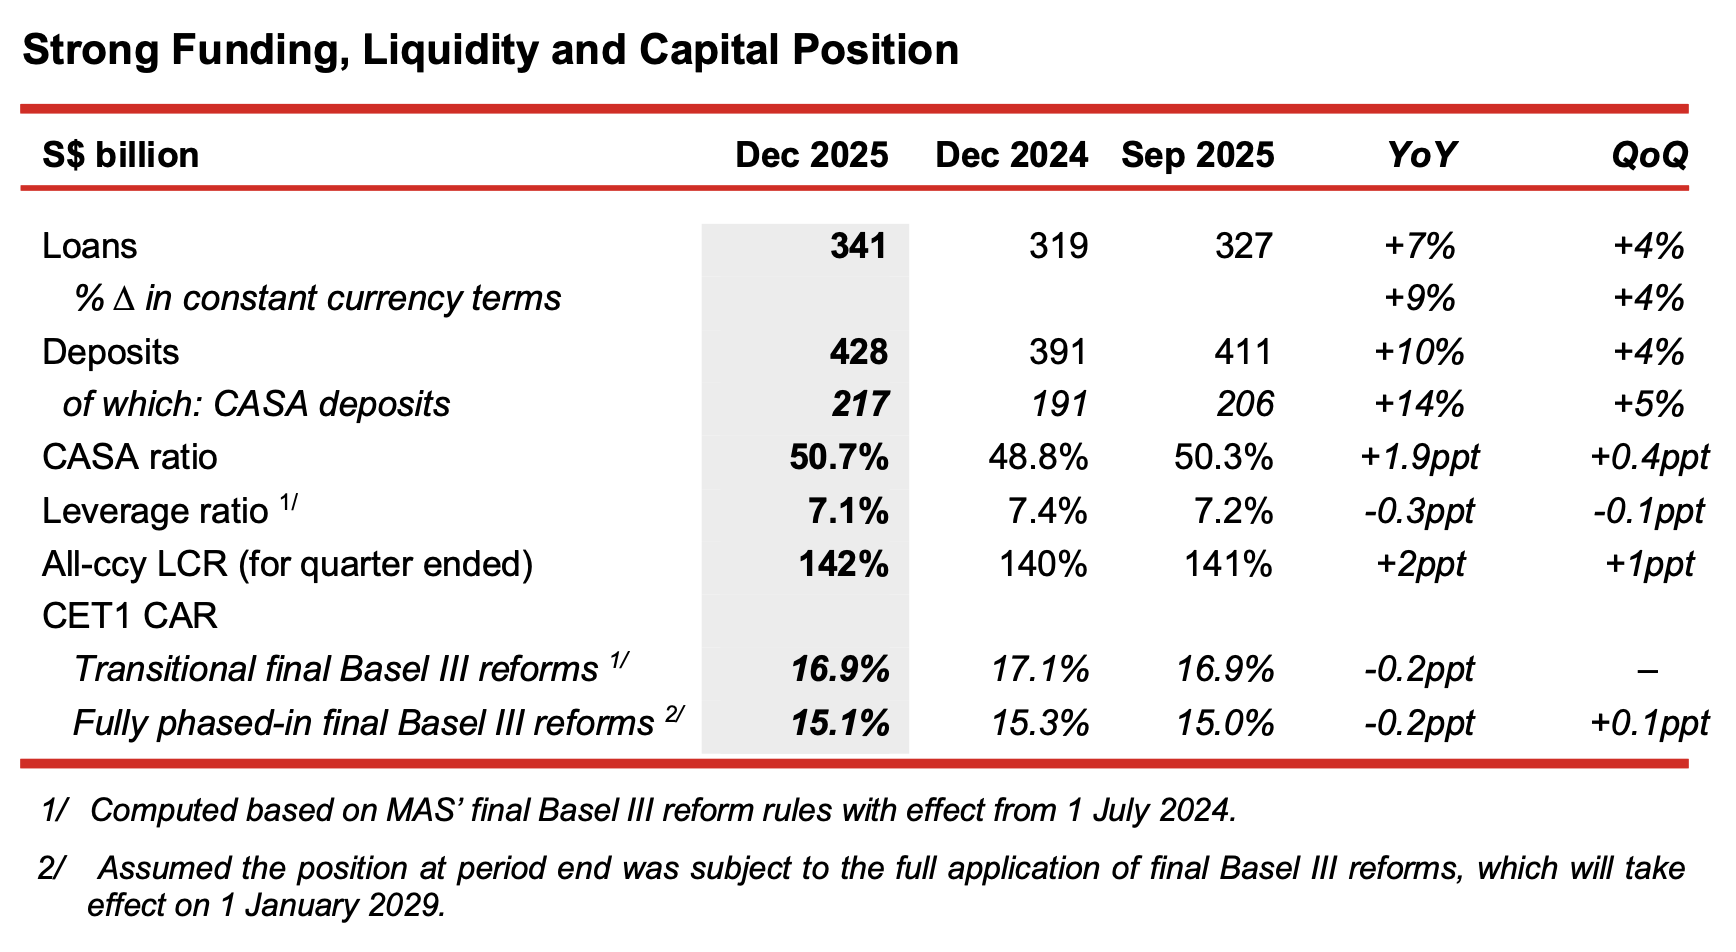
- Customer loan growth remained resilient. Loans grew 9% from a year ago to S$341 billion as at 31 December 2025 on a constant currency basis. Against the previous quarter, loans were 4% higher supported by growth across all key regional and international markets.
- Both year-on-year and quarter-on-quarter loan growth were broad-based across industries. By customer segment, trade and non-trade corporate loans, as well as consumer loans (from both residential mortgages and wealth segments), contributed to the uplift.
- This was in line with the Group’s strategic drive to capture opportunities in key growth sectors such as sustainable financing, TMT including digital infrastructure, transport, and Singapore residential mortgages.
- Sustainable financing loan portfolio expanded 13% from a year ago to S$56.5 billion and made up 17% of Group loans, while total commitments stood at S$80.0 billion.
- Customer deposits rose 10% to S$428 billion from a year ago, mainly driven by CASA deposit growth across consumer, SME and corporate segments.
- Loans-to-deposits ratio was 78.6%, unchanged from the previous quarter.
- The Group’s CET1 CAR is subject to MAS’ final Basel III reforms requirements which came into effect on 1 July 2024 and are being progressively phased in between 1 July 2024 and 1 January 2029. Group CET1 CAR as at 31 December 2025 was 16.9%, and on a fully phased-in basis, it was 15.1%.
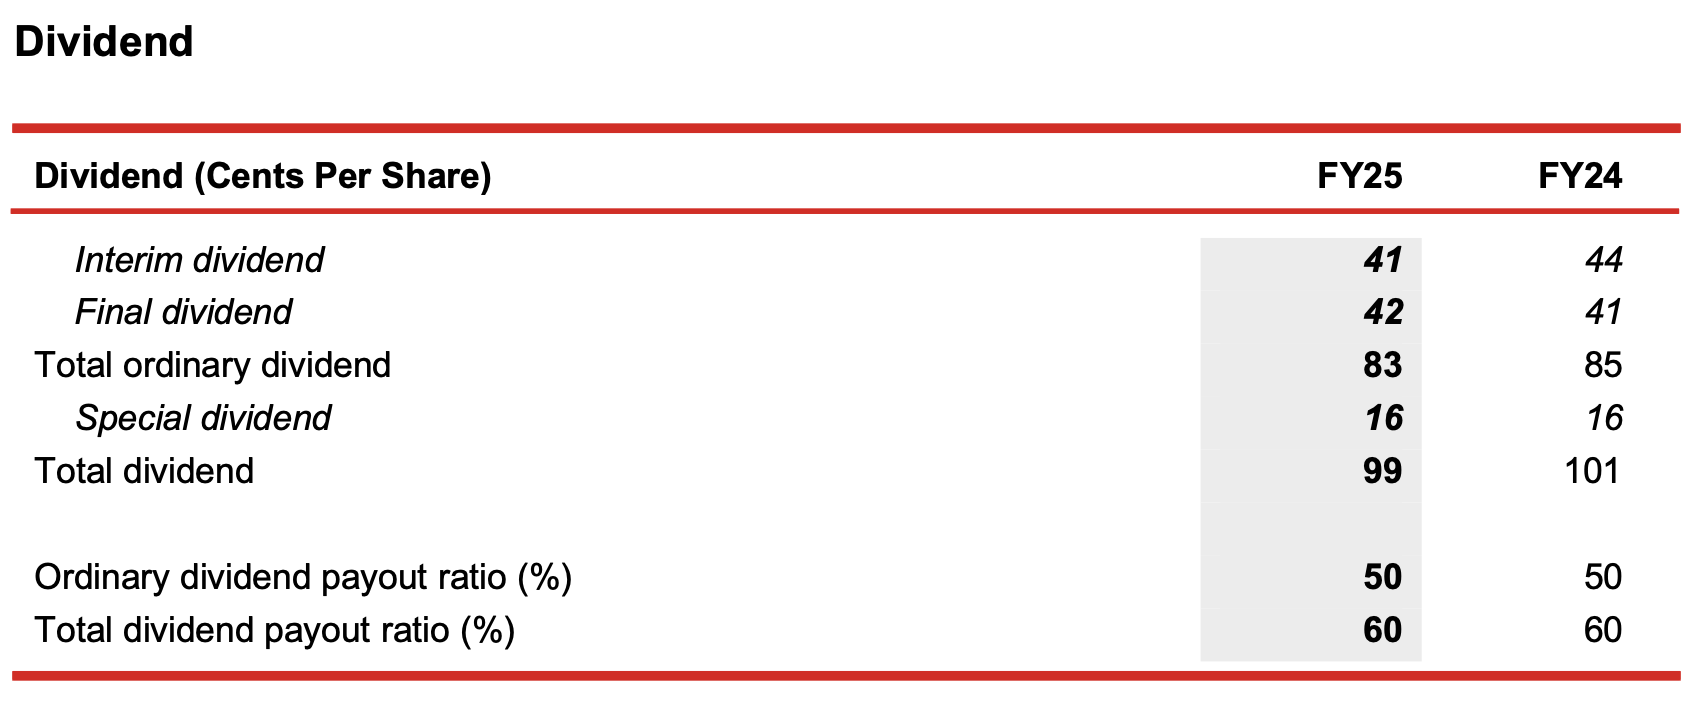
- The Board has proposed a final ordinary dividend of 42 cents per share for FY25, higher than the interim dividend of 41 cents. Together with the interim ordinary dividend, total ordinary dividend for FY25 will be 83 cents.
- A special dividend of 16 cents per share is recommended as part of the announced capital return plan, bringing total dividend to 99 cents per share.
- Total payout will amount to S$4.45 billion, which is in line with the Group’s target payout ratio of 50% for ordinary dividend and 10% for special dividend for FY25.
- The Scrip Dividend Scheme will not be applicable to the final ordinary and special dividend.
- The S$2.5 billion capital return plan is targeted to be completed by FY26.
Message from Group CEO, Tan Teck Long
“I am pleased to report that the Group delivered another year of strong performance, demonstrating the resilience of our franchise. Profit before tax surpassed S$9 billion for the first time, driven by robust growth across our Banking, Wealth Management and Insurance businesses. Wealth management income reached record levels, and we sustained healthy loan growth and maintained strong asset quality. These results reflect the strength of our fundamentals and our disciplined execution amid a challenging operating environment.
As we close out our previous three-year strategy, during which we achieved commendable progress by unifying our brand across our core markets and realising stronger synergies under our One Group approach, we have launched our new corporate strategy, The Next Frontier. This strategy positions us to compete and win in the next phase of growth by capturing rising Asia flows, deepening our core market franchise, advancing technology led and customer centric capabilities through AI, Digital and Data, and continuing our support for green transition.
Looking ahead, we remain cautious yet positive. Global conditions are likely to remain uncertain, shaped by geopolitical tensions, evolving trade dynamics and interest rate uncertainty. Against this backdrop, our strong balance sheet, prudent risk management and diversified growth engines position us well to navigate the challenging environment and deliver sustainable long term value.”