OCBC Full Year 2023 Net Profit Rose 27% to a Record S$7.02 billion
OCBC Full Year 2023 Net Profit Rose 27% to a Record S$7.02 billion
Fourth quarter net profit up 12% from a year ago to S$1.62 billion
2023 full year dividend raised to 82 cents, up 21% from 68 cents in 2022
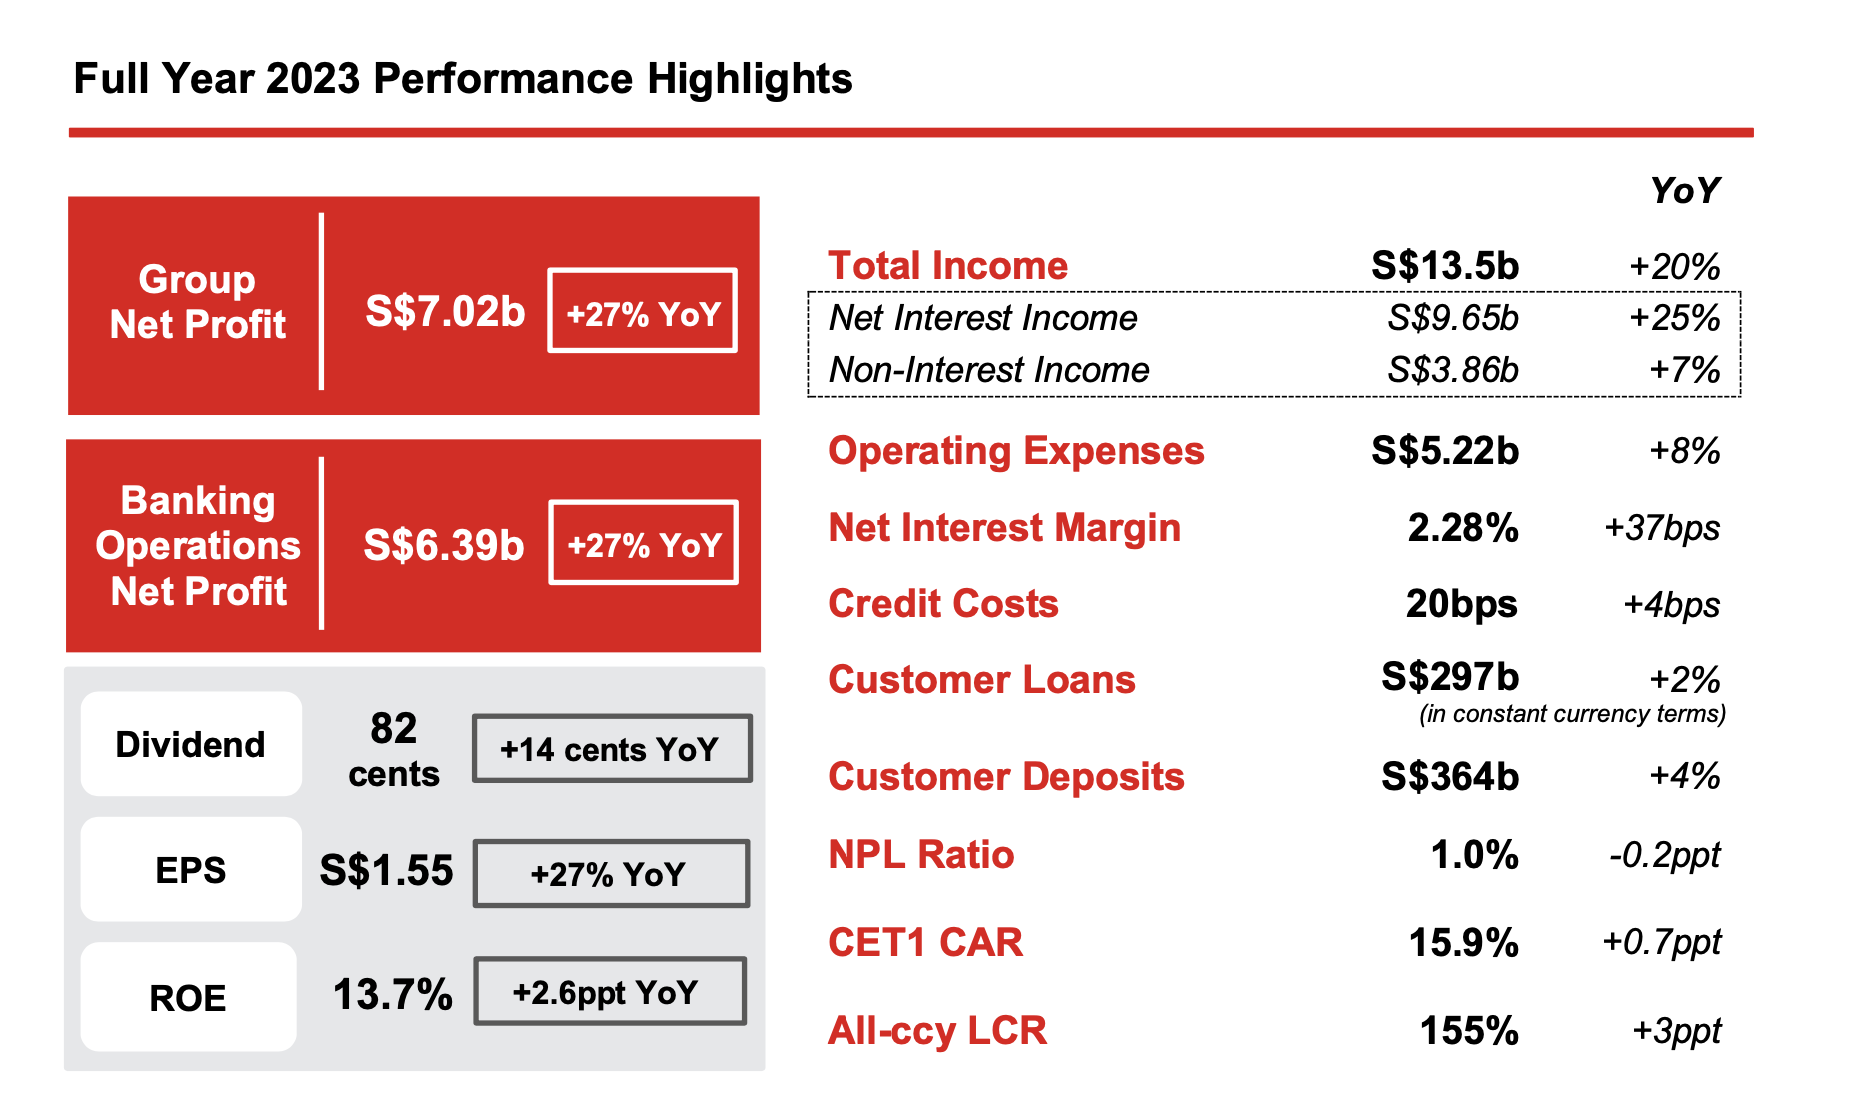
Singapore, 28 February 2024 – Oversea-Chinese Banking Corporation Limited (“OCBC”) reported net profit of S$7.02 billion for the financial year 2023 (“FY23”), up 27% from S$5.53 billion a year ago (“FY22”).
Total income for FY23 rose to a new high of S$13.5 billion, lifted by growth across the Group’s diversified income streams, with net interest income at a record high, and trading and investment income higher. Loan-related and credit card fees rose, but overall fee income was down as subdued investment sentiments continued to weigh on wealth-related fees. Continued cost discipline amid an inflationary environment, combined with income growth, drove the cost-to-income ratio lower to 38.7%. Asset quality was resilient with NPL ratio of 1.0% and credit costs at 20 basis points. The Group’s strong capital, funding and liquidity levels provide ample headroom to drive growth and capture opportunities as they arise.
With strong earnings and sound capital position, the Board is pleased to recommend an increase in the final dividend to 42 cents per share from 40 cents a year ago. This brings the FY23 dividend to 82 cents per share, up 21% from 68 cents a year ago and represents a payout ratio of 53% of the Group’s FY23 net profit.
FY23 Year-on-Year Performance
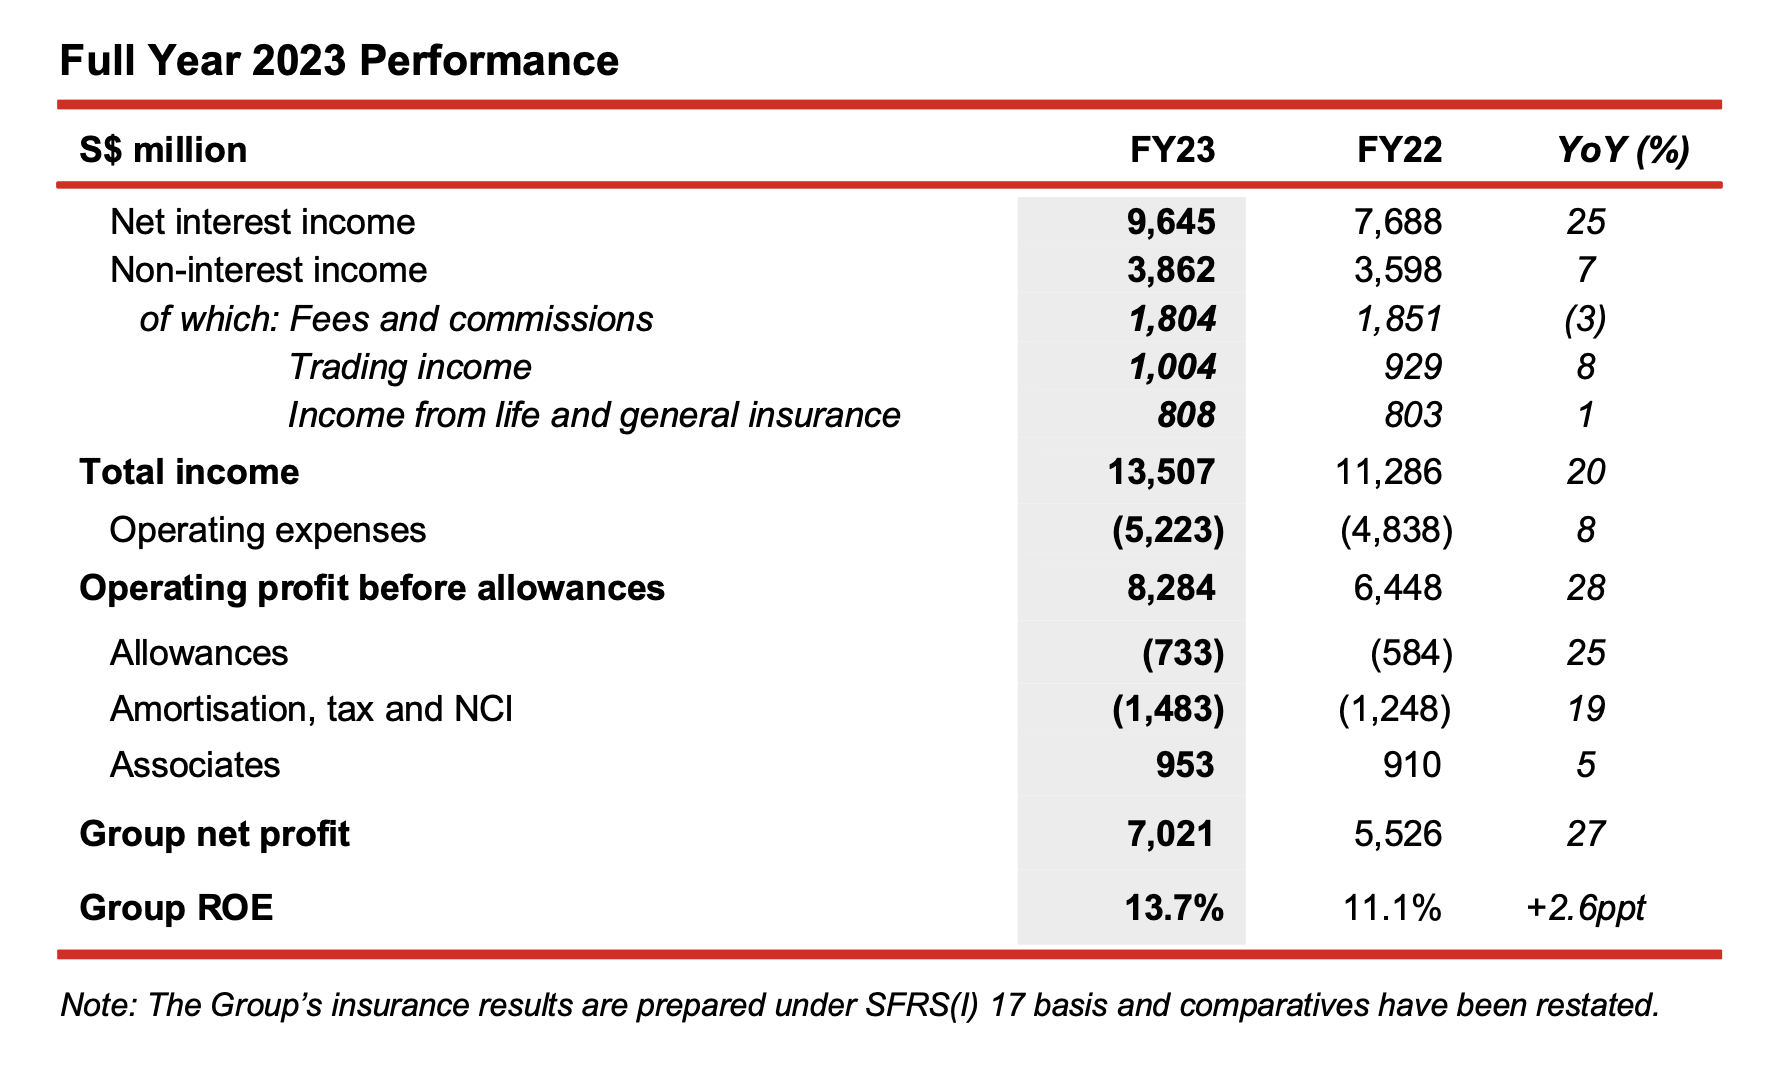
Group net profit grew 27% and crossed S$7 billion for the first time.
- Record net interest income of S$9.65 billion was 25% higher than a year ago, underpinned by a 5% growth in average assets and a 37-basis point expansion in net interest margin (“NIM”) to 2.28%. NIM was higher across all key markets, benefitting from the higher interest rate environment and proactive balance sheet management.
- Non-interest income rose 7% to S$3.86 billion. The increase was largely attributed to improved trading income and investment gains.
- Net fee income of S$1.80 billion was 3% below the S$1.85 billion in the previous year. Higher fees from credit card and loan-related activities were more than offset by lower wealth-related fees as customer activities remained subdued amid global risk-off investment sentiments.
- Net trading income improved 8% to S$1.00 billion, from S$929 million a year ago, driven by record customer flow treasury income.
- Net realised gains from sale of investment securities were S$47 million, as compared to a net loss of S$206 million in FY22 that was largely attributed to rebalancing of the fixed income portfolio.
- Insurance income was S$808 million as compared to S$803 million a year ago. GEH adopted Singapore Financial Reporting Standards (International) [“SFRS(I)”] 17 on 1 January 2023, and the Group’s insurance results for FY23 are prepared based on SFRS(I) 17 and respective comparative periods for 2022 have been restated. Total weighted new sales and new business embedded value (“NBEV”) were S$1.66 billion and S$762 million respectively, while NBEV margin was higher at 45.9%. GEH’s embedded value, a measure of the long-term economic value of the existing business of a life insurance company, was S$17.3 billion as at 31 December 2023.
- The Group’s wealth management income, comprising income from insurance, private banking, premier private client, premier banking, asset management and stockbroking comprised 32% of the Group’s total income. Wealth management income for FY23 rose 26% to S$4.32 billion, up from S$3.42 billion a year ago. Group wealth management AUM expanded 2% to S$263 billion, from S$258 billion in the previous year.
- Operating expenses increased 8% to S$5.22 billion. This was largely attributed to higher staff costs, IT-related costs and other operational expenses associated with business growth. The rise in staff costs was led by annual salary adjustments, headcount growth and a one-off support to help junior employees cope with rising cost-of-living concerns. Cost-to-income ratio (“CIR”) improved to 38.7% in FY23, from 42.9% in the prior year.
- Total allowances were S$733 million, up 25% from S$584 million in the previous year.
- Share of results of associates grew 5% to S$953 million, from S$910 million a year ago.
- The Group’s ROE for FY23 improved to 13.7%, from 11.1% a year ago. Earnings per share was 27% higher at S$1.55, compared to S$1.22 in the previous year.
4Q23 Year-on-Year Performance
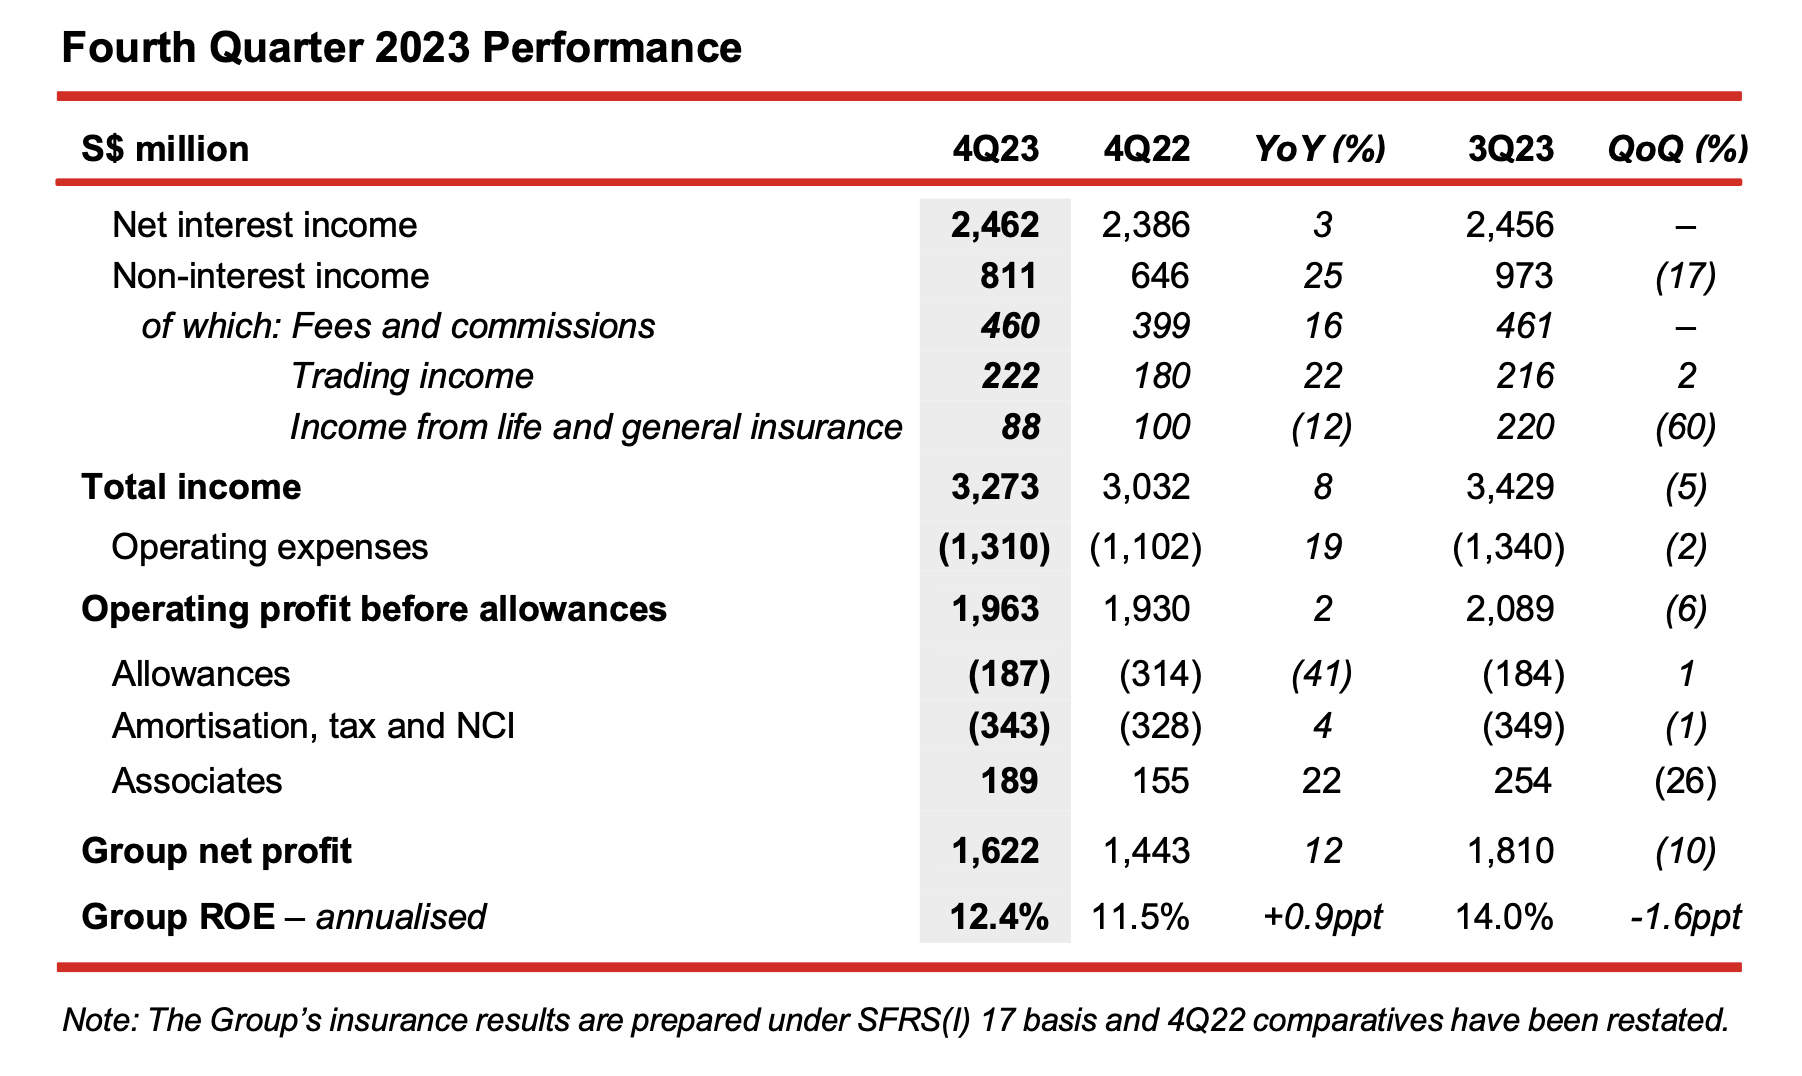
Group net profit rose 12% to S$1.62 billion, driven by a 2% increase in operating profit and lower allowances.
- Net interest income grew 3% to S$2.46 billion, led by a 4% increase in average assets. NIM moderated 2 basis points to 2.29% from 2.31% in 4Q22, from higher funding costs which more than offset the increase in asset yields.
- Non-interest income rose 25% to S$811 million.
- Net fee income increased 16% to S$460 million, from S$399 million a year ago, led by higher fees from wealth management, credit card and loan-related activities.
- Net trading income improved 22% to S$222 million, driven by higher customer flow treasury income, while insurance income was S$88 million as compared to S$100 million a year ago.
- 4Q23 saw a net gain of S$6 million from sale of investment securities, as compared to a net loss of S$67 million in the previous year arising from repositioning of the bond portfolio.
- Operating expenses were S$1.31 billion, up 19% led by higher staff costs and other operating expenses.
- Total allowances were S$187 million, down 41% from S$314 million a year ago, as a result of a decline in allowances for both impaired and non-impaired assets.
- Share of results of associates increased 22% to S$189 million.
4Q23 Quarter-on-Quarter Performance
Net profit was 10% lower, led by a decline in insurance income and lower profit from associates.
- Net interest income rose marginally, while fee income was sustained at previous quarter’s level. Loan-related and investment banking fee income were higher, but were offset by seasonally softer wealth-related fee income.
- Trading income improved 2% from an increase in non-customer flow treasury income and better investment performance.
- Insurance income was 60% lower compared to a quarter ago, mainly attributable to higher insurance claims.
- Operating expenses was 2% lower, while total allowances of S$187 million were comparable to S$184 million in the previous quarter.
- Share of results of associates was 26% below the previous quarter.
Asset Quality
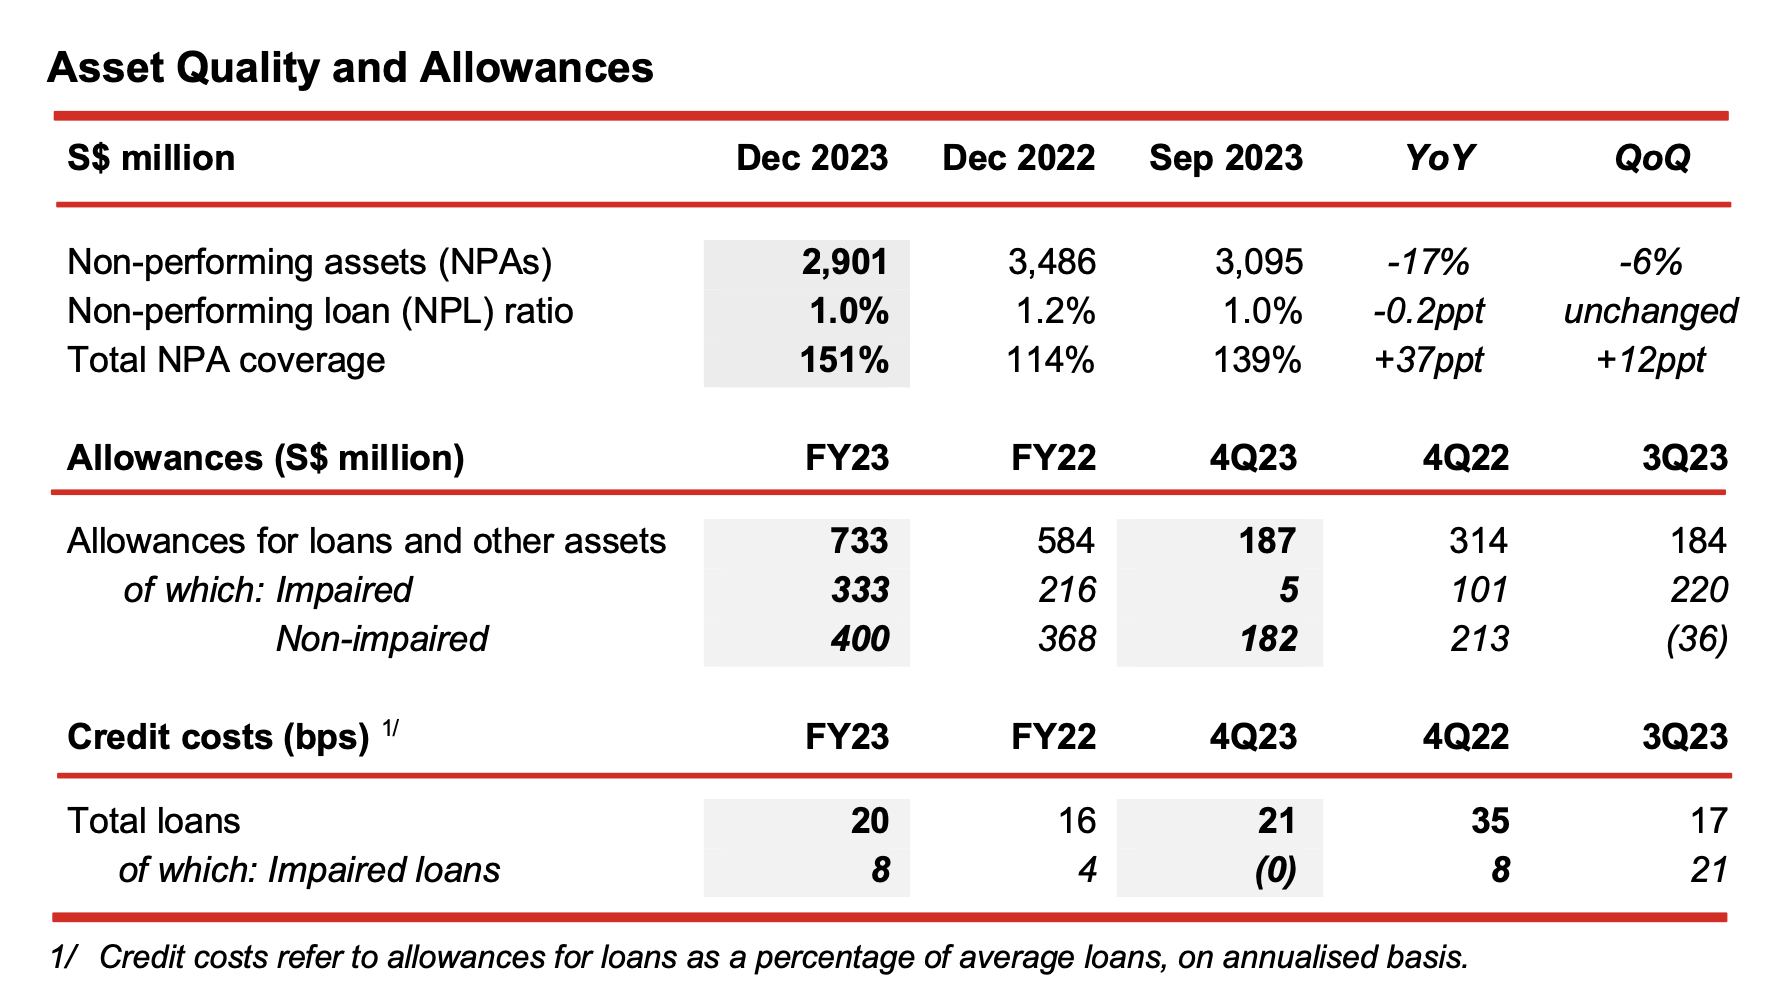
- Total NPAs were lower at S$2.90 billion as at 31 December 2023, 6% below the previous quarter and 17% lower than a year ago.
- Against the previous quarter, NPAs declined as recoveries, upgrades and write-offs more than offset new NPA formation which was lower across both corporate and consumer segments.
- NPL ratio of 1.0% was unchanged from a quarter ago and improved from 1.2% a year ago. Allowance coverage against total NPAs increased to 151% from 114% a year ago.
Allowances
- Total allowances for 4Q23 were S$187 million. These comprised:
- Allowances for impaired assets of S$5 million.
- Allowances for non-impaired assets of S$182 million, largely to reflect changes in portfolio risk profiles and updates of macro-economic variables (“MEV”) in the Expected Credit Loss (“ECL”) model.
- For FY23, total allowances were S$733 million, up 25% from S$584 million a year ago, from allowances for both impaired and non-impaired assets.
- Allowances for impaired assets were S$333 million, up from S$216 million in the previous year.
- Non-impaired allowances of S$400 million were set aside to account for MEV updates, shifts in risk profiles and management overlays, taking a forward-looking view.
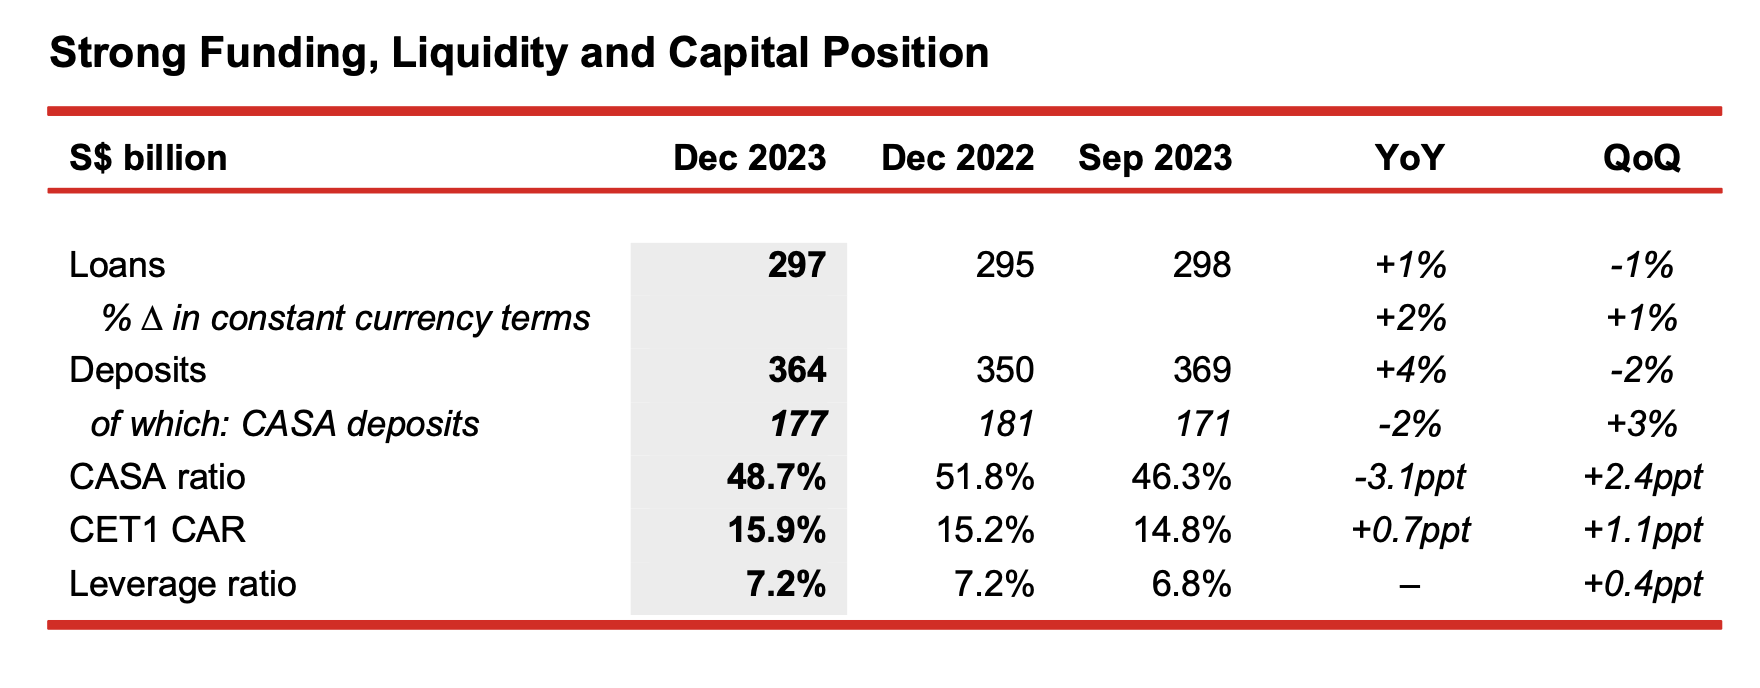
- As at 31 December 2023, customer loans were S$297 billion. In constant currency terms, loans were 2% higher than the previous year.
- Loan growth for the year was driven by both non-trade corporate and housing loans, which compensated for weak trade loan demand. By geography, the increase from a year ago was led by higher loans in Singapore, Australia, Europe and the United Kingdom.
- As at 31 December 2023, sustainable financing loans grew 29% from a year ago to S$38.4 billion, against a total loan commitment of S$56 billion.
- Customer deposits rose 4% year-on-year to S$364 billion. Against the previous quarter, deposits were 2% lower, as a decline in higher-cost fixed deposits more than offset a rise in CASA deposits. CASA ratio improved to 48.7% from 46.3% a quarter ago.
- Loans-to-deposits ratio increased to 80.5%, from 79.7% a quarter ago.
- Group CET1 CAR was 15.9%, while the leverage ratio was 7.2%.
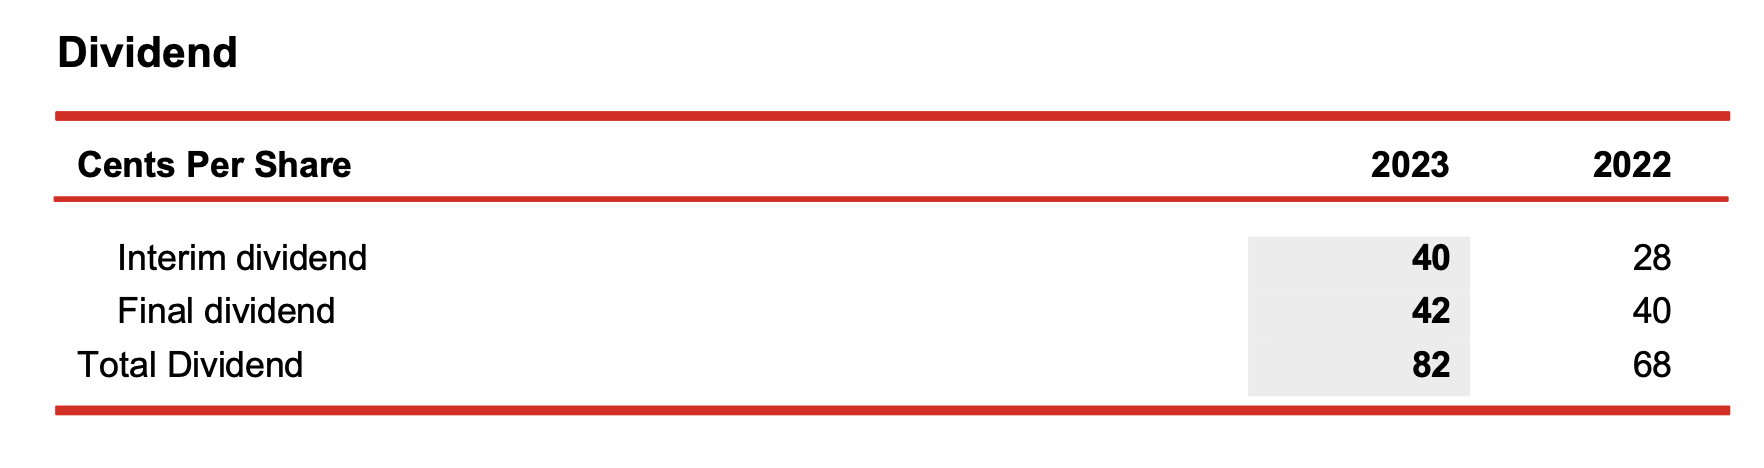
- The Board has proposed a final dividend of 42 cents per share, an increase from 40 cents a year ago.
- This brings total dividend for FY23 to 82 cents per share, up 14 cents or 21% from FY22. The total dividend payout will amount to S$3.69 billion, representing a payout ratio of 53%.
- The Scrip Dividend Scheme will not be applicable to the final dividend.
Message from Group CEO, Helen Wong
“I am delighted to report another year of record profit for 2023, which crossed S$7 billion for the first time. Broad-based income growth across business segments drove total income to an all-time high, while expenses were well controlled. Strong credit discipline was reflected by lower NPL ratio and higher allowance coverage. Our robust performance for 2023 is a testament to the strength of our well-diversified business franchise and reflected the results of our transformation and growth strategy. With our resilient performance, we are pleased to raise the full year dividend by 14 cents or 21% to 82 cents per share, which represents a payout ratio of 53%.
In line with our focus on sustainability, I am proud to report that we have made good progress in our journey towards a low-carbon economy. We have announced our decarbonisation targets, aiming to achieve net-zero financed emissions by 2050. In addition to this significant milestone, our sustainable finance commitments have surpassed S$50 billion, exceeding our 2025 target two years ahead of schedule. In solidarity with our junior colleagues, we are giving a one-off support to help them cope with higher living costs.
Our results demonstrated the successful execution of our strategic priorities to accelerate growth. Notably, we launched our unified OCBC brand in 2023, accompanied by a refreshed logo and new tagline “For Now, and Beyond”. This strategic move solidifies our OCBC One Group approach as we pursue strong growth across ASEAN and Greater China. It signals the importance to collaborate and work as a team across all businesses and geographies to support our customers. We have expanded our customer base across segments through cross-border initiatives and digitalisation, deepened our regional presence with strategic partnerships, enhanced our network coverage, as well as strengthened our talent pool. We also announced strategic acquisitions of AmMetLife Insurance and AmMetLife Takaful in Malaysia and PT Bank Commonwealth in Indonesia to boost our presence and accelerate growth in ASEAN, pending regulatory approvals.
Looking ahead, we anticipate challenges in the global macro environment, including changes in monetary policies, persistent inflationary pressures, major elections and rising geopolitical tensions. Nonetheless, we believe that Asia holds immense growth potential. We remain steadfast in executing our ASEAN-Greater China growth strategy to deliver sustainable value for our stakeholders. Our strong capital, liquidity and funding positions enable us to seize opportunities as they arise, while providing adequate buffers to navigate uncertainties.”