OCBC Group half year 2023 net profit rose 38% to a record S$3.59 billion
OCBC Group half year 2023 net profit rose 38% to a record S$3.59 billion
Interim dividend raised to 40 cents, up 43% from 28 cents a year ago
Singapore, 4 August 2023 – Oversea-Chinese Banking Corporation Limited (“OCBC”) reported net profit of S$3.59 billion for half year 2023 (“1H23”), 38% higher than S$2.59 billion in the previous year (“1H22”).
The Group’s resilient performance demonstrated the strength of OCBC’s diversified business franchise. Total income rose to a new high, underpinned by record net interest income, higher trading and investment income, and increased insurance profit. These compensated for softer wealth management fees amid subdued global investment sentiments, although the Group’s wealth management Assets Under Management (“AUM”) rose 10% year-on-year to S$274 billion on continued inflows of net new money. Expenses were well controlled and cost-to-income ratio improved from 47.1% in the previous year to 37.8% in 1H23. Loan portfolio quality was resilient, with non-performing loans ratio at 1.1%. Allowances were higher, as the Group took a prudent approach to raise its allowances set aside for non-impaired assets. The Group maintained its strong capital, funding and liquidity positions, which provide for sufficient headroom to drive future growth and buffer for uncertainties.
We are pleased to raise the 2023 interim dividend to 40 cents, up 43% or 12 cents from a year ago. This represents a payout ratio of 50% of the Group’s 1H23 net profit.
1H23 Year-on-Year Performance
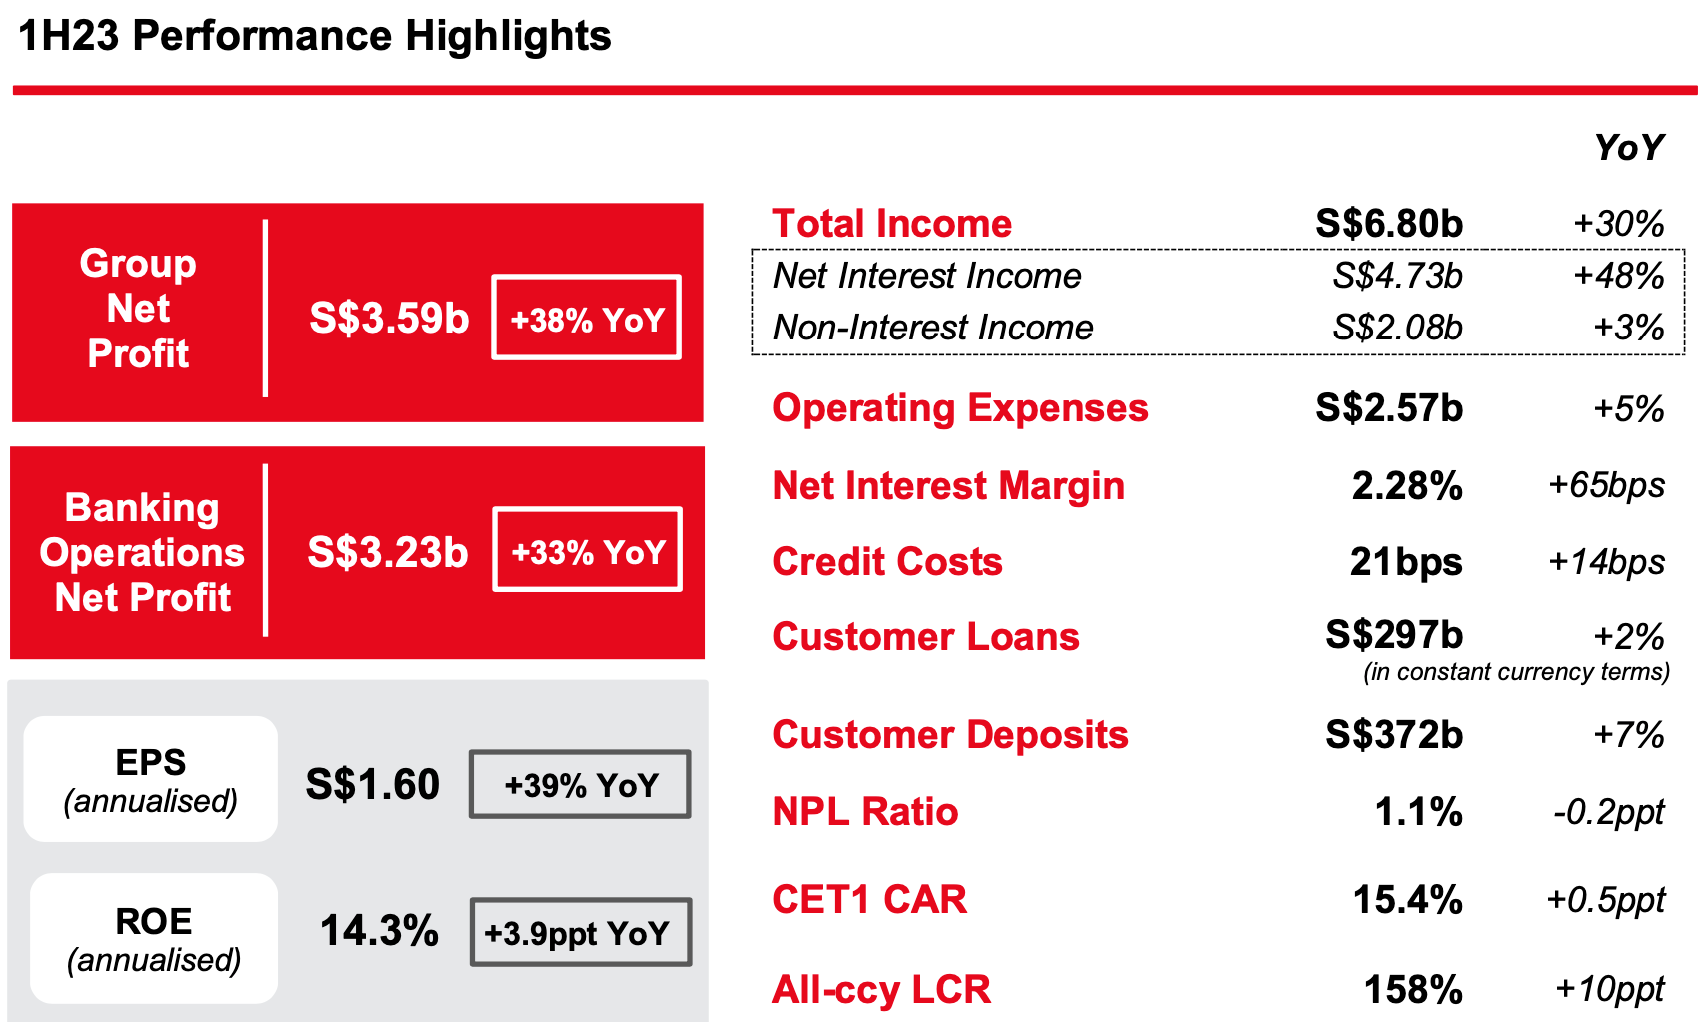
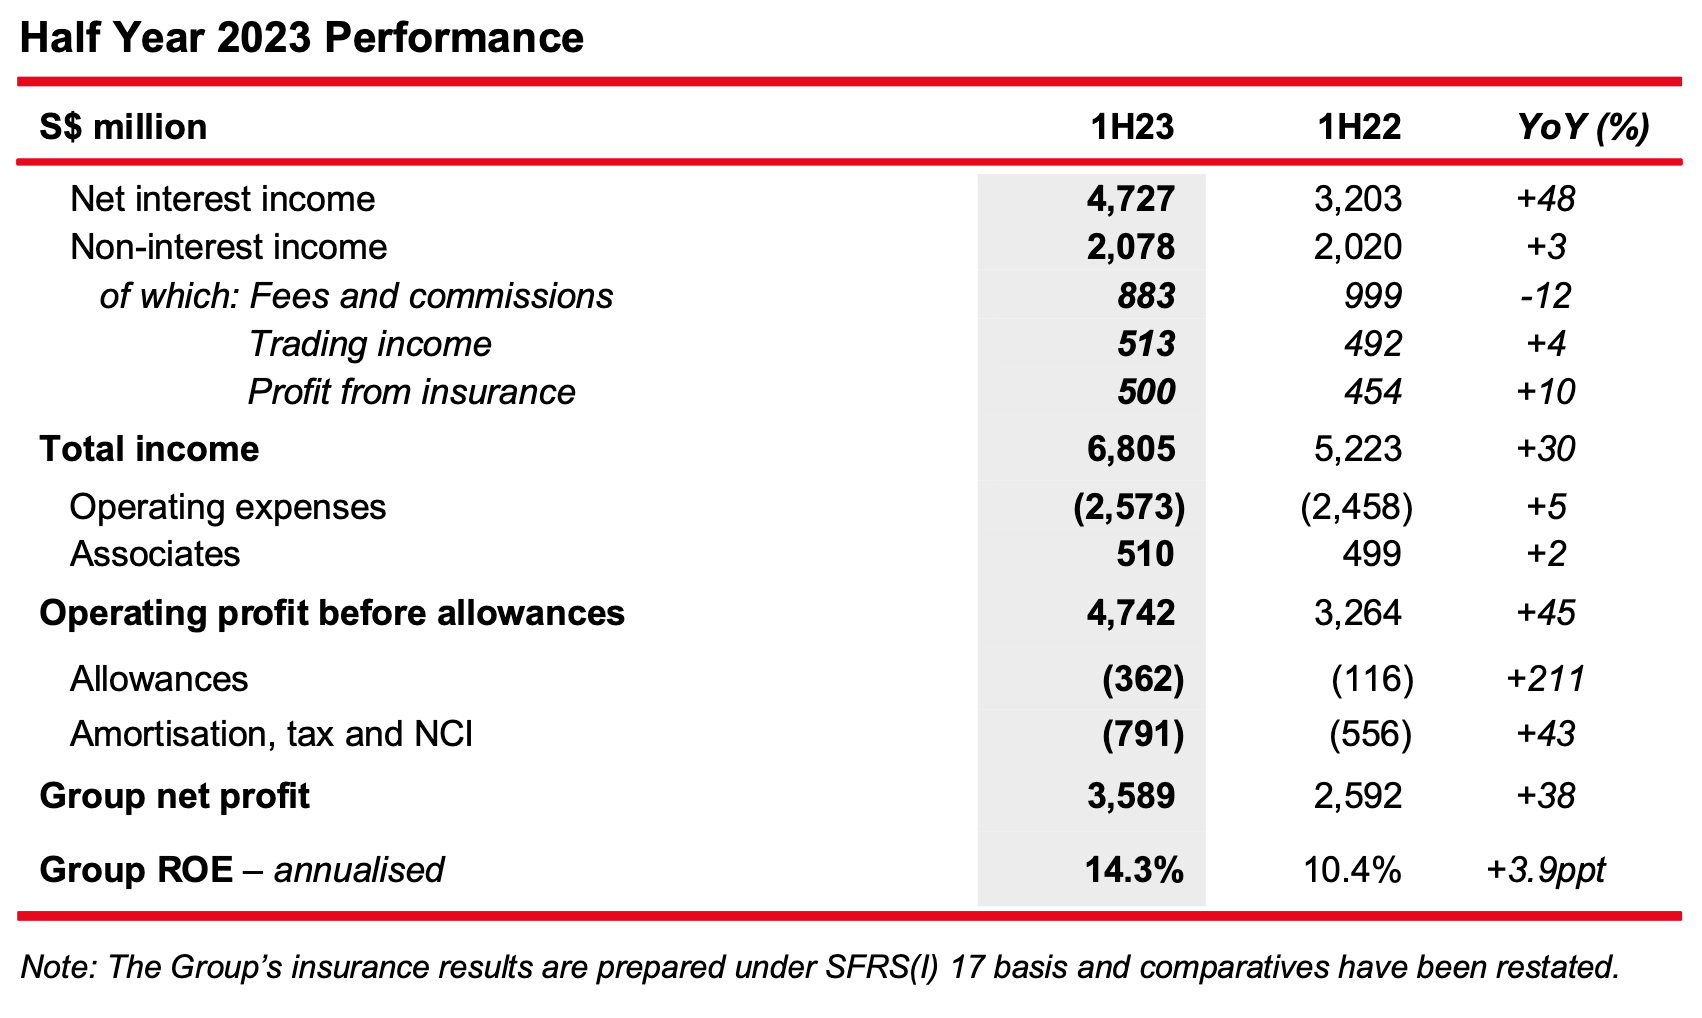
- Group net profit rose 38% from 1H22 to a new high of S$3.59 billion, driven by record income.
- Net interest income grew 48% to S$4.73 billion, attributable to a 6% increase in average assets and a 65-basis point expansion in net interest margin (“NIM”) to 2.28%.
- Non-interest income was S$2.08 billion, up 3% from S$2.02 billion in the previous year. Higher trading, investment and insurance income were offset by lower fee income.
- Net fee income was S$883 million, down 12% as higher loan-related and investment banking fees were offset by softer wealth management-related fees from a decline in customer activities amid a risk-off investment environment.
- Net trading income was higher at S$513 million, compared to S$492 million in the preceding year, while net gains from the sale of investment securities were S$38 million, against a net loss of S$78 million in the previous year.
- Profit from insurance of S$500 million was 10% higher than a year ago, mainly attributable to improved investment performance. Great Eastern Holdings (“GEH”) adopted Singapore Financial Reporting Standards (International) [“SFRS(I)”] 17 on 1 January 2023, and the Group’s insurance results for 1H23 are prepared based on SFRS(I) 17 and respective comparative periods have been restated. Total weighted new sales and new business embedded value (“NBEV”) were S$726 million and S$351 million respectively, while NBEV margin improved to 48.4% from 37.1% a year ago attributable to favourable product mix.
- The Group’s wealth management income, comprising income from insurance, private banking, premier private client, premier banking, asset management and stockbroking, rose 36% to S$2.24 billion for 1H23, from S$1.64 billion in the previous year, and contributed 33% to the Group’s total income. Group wealth management AUM continued to expand and was 10% higher at S$274 billion as at 30 June 2023, compared to S$250 billion in the preceding year, driven by continued net new money inflows.
- Operating expenses rose 5%, largely from higher staff-related costs associated with headcount expansion to support business growth and annual salary adjustments. Other expenses including business promotion were also higher, in line with a rise in business volumes. The Group’s cost-toincome ratio (“CIR”) improved from 47.1% in the previous year to 37.8% in 1H23.
- Share of results of associates was S$510 million, up 2% from S$499 million a year ago.
- Net allowances were S$362 million as compared to S$116 million in the previous year. The Group took a prudent approach to raise allowances for non-impaired assets, which rose from S$79 million in the previous year to S$254 million in 1H23.
- Annualised ROE for 1H23 improved to 14.3%, from 10.4% in the preceding year. Earnings per share was S$1.60, up 39% from S$1.15 in 1H22.
2Q23 Year-on-Year Performance
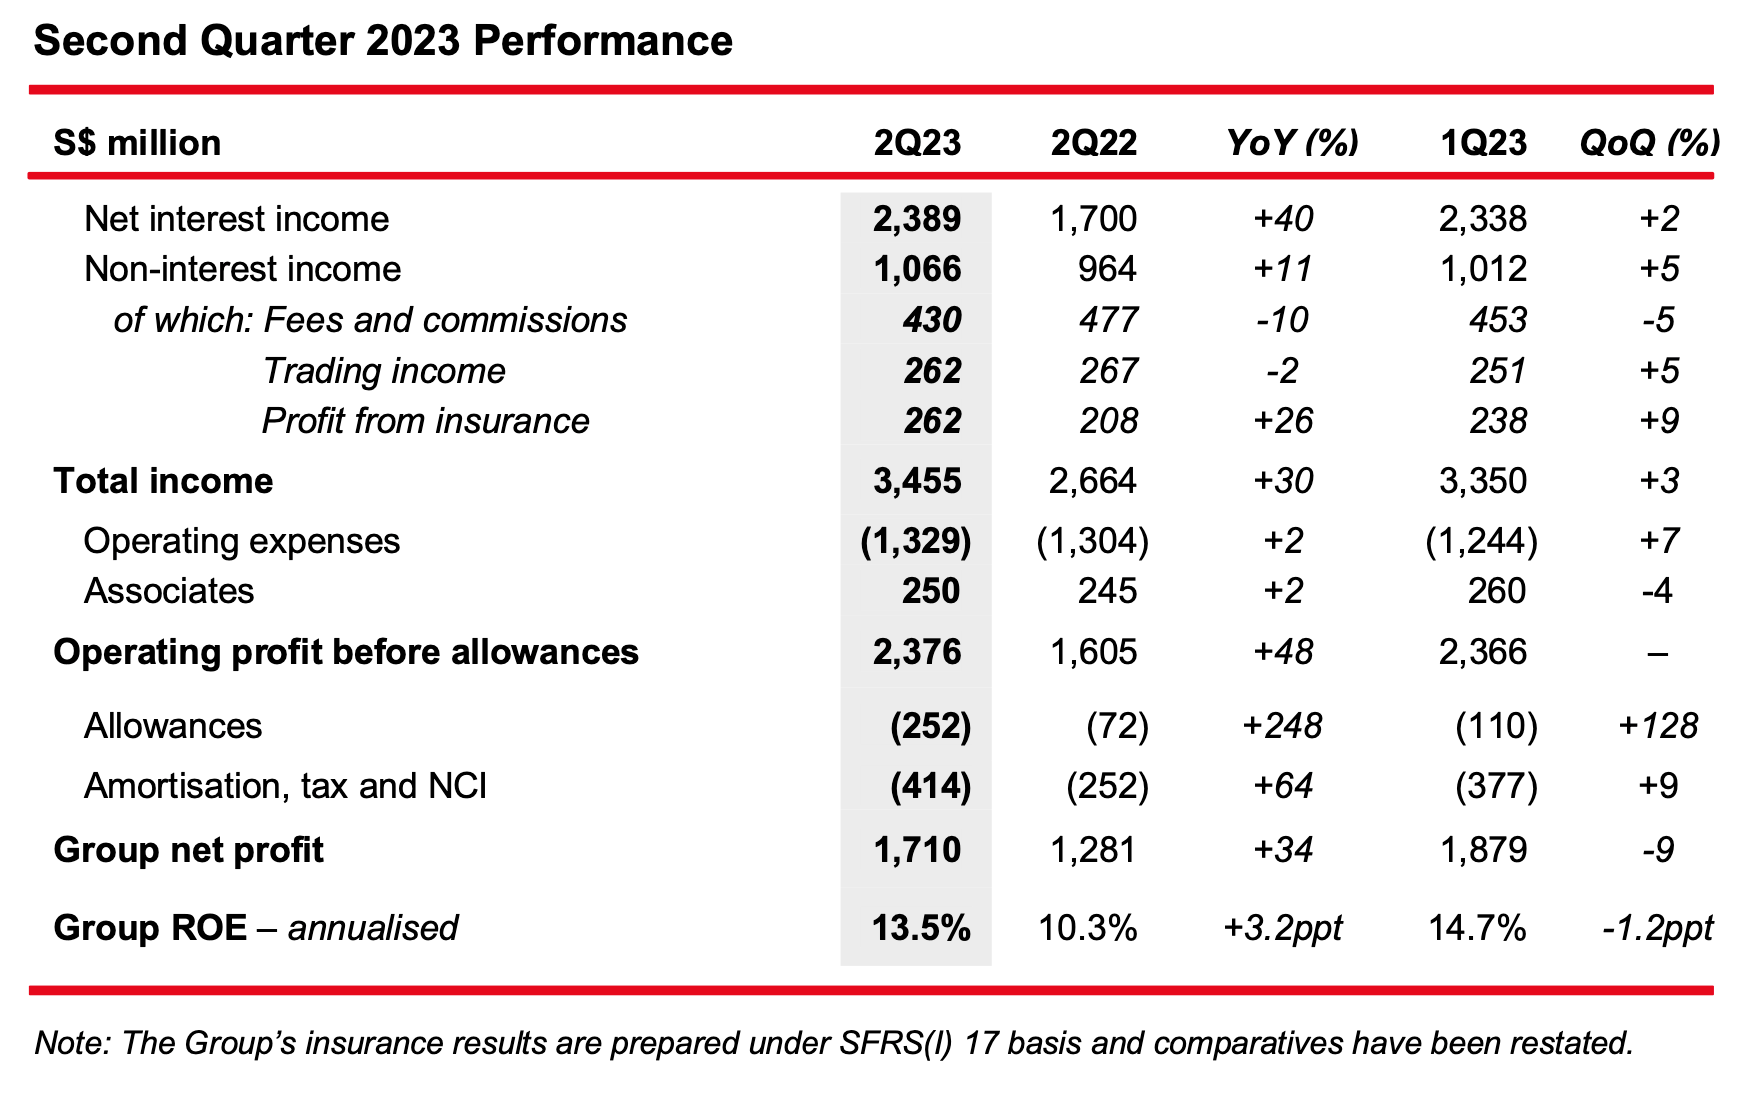
- Group net profit was 34% higher than 2Q22 at S$1.71 billion, driven by strong income growth, partly offset by higher allowances.
- Net interest income rose 40% to S$2.39 billion, underpinned by asset growth and a 55-basis point increase in NIM to 2.26% on the back of the rapid rise in market interest rates.
- Non-interest income grew 11% to S$1.07 billion, mainly from net gains from the sale of investment securities and higher profit from insurance, partly offset by lower fee and trading income.
- Operating expenses of S$1.33 billion were 2% above 2Q22, led by an increase in staff costs. CIR was lower at 38.5% compared to 49.0% last year.
- Share of results of associates rose 2% to S$250 million in 2Q23.
- Total allowances were higher at S$252 million, compared to S$72 million a year ago, largely driven by increased allowances for non-impaired assets.
2Q23 Quarter-on-Quarter Performance
- Group net profit was 9% lower than 1Q23, as a 1% increase in operating profit was more than offset by higher allowances.
- Net interest income rose 2%, supported by 3% asset growth, partly offset by a 4-basis point drop in NIM as higher funding costs outpaced the increase in loan yields.
- Non-interest income was 5% higher than the previous quarter, supported by improved trading income and higher profit from insurance.
- Expenses increased 7%, led by a rise in staff costs mainly from annual salary adjustments that took effect in the second quarter and an increase in headcount.
- Share of results of associates was 4% lower than a quarter ago.
- Total allowances were above 1Q23 from a rise in allowances for non-impaired assets.
Asset Quality
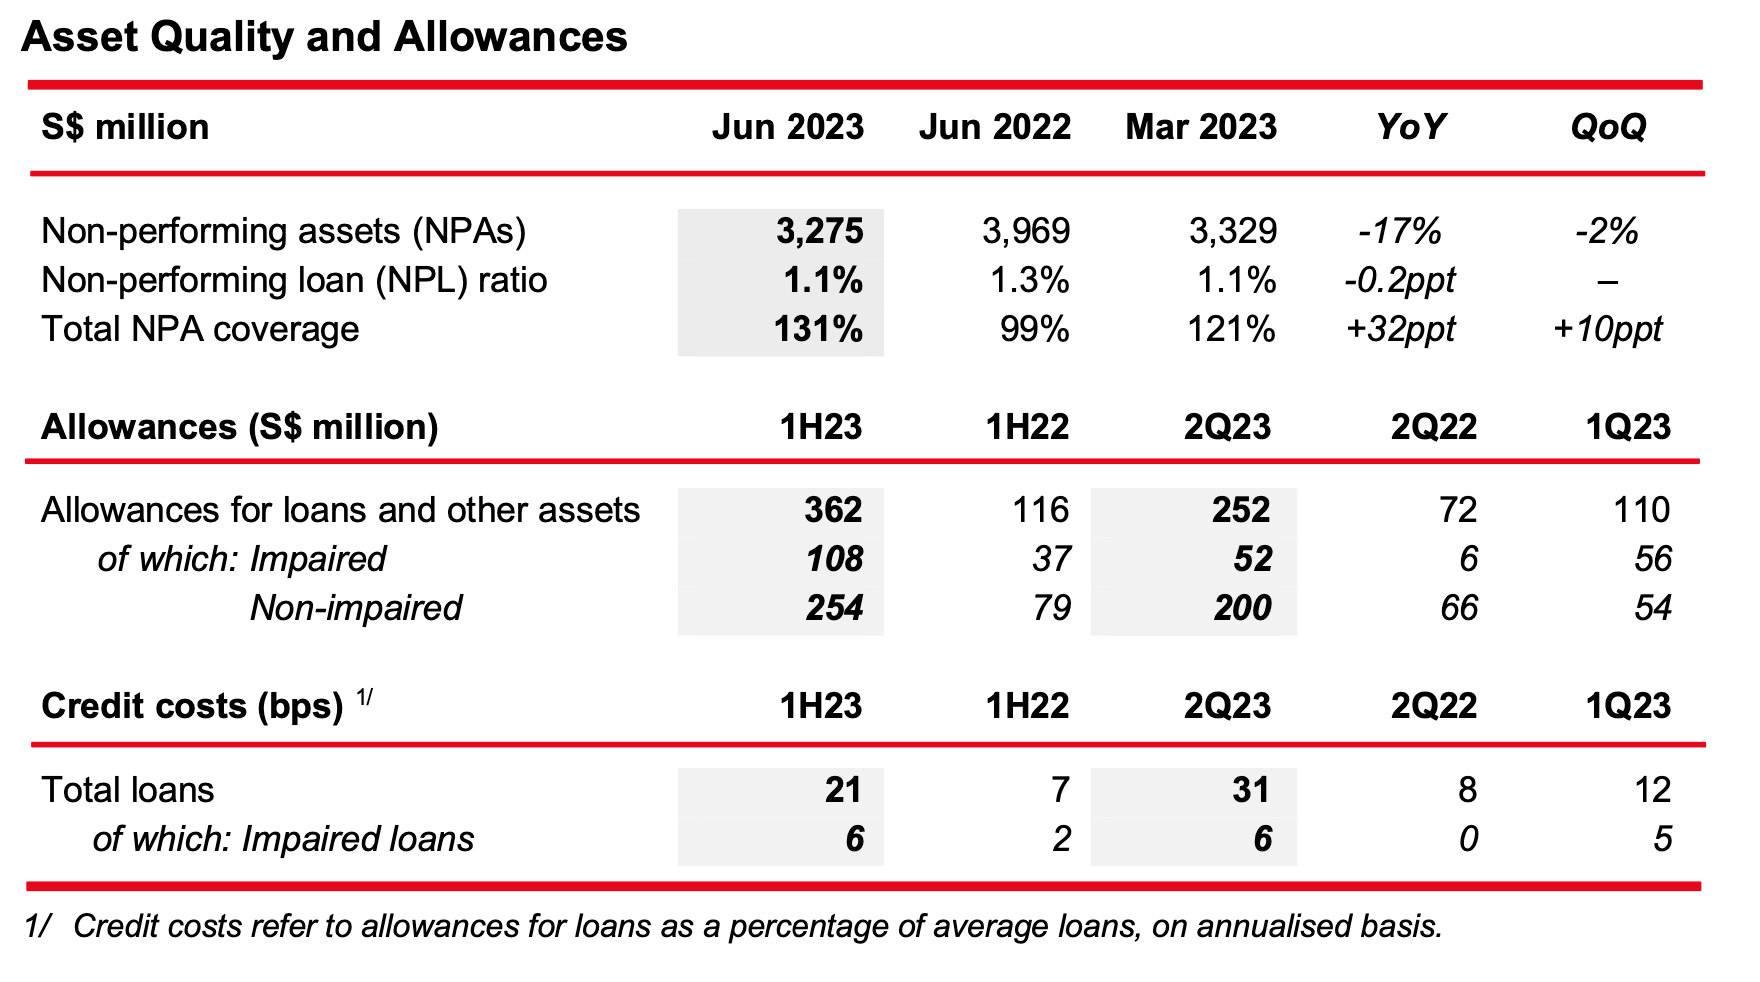
- Total NPAs declined 17% from the previous year and 2% from a quarter ago to S$3.27 billion as at 30 June 2023. NPAs declined from the previous quarter as higher recoveries, upgrades and write-offs more than offset new NPA formation during the quarter. The higher recoveries and upgrades were mainly from Singapore, Malaysia and Indonesia.
- NPL ratio was stable quarter-on-quarter at 1.1% and down from 1.3% a year ago. Allowance coverage against total NPAs further improved to 131% from 99% in the previous year.
Allowances
- 1H23 total allowances were higher at S$362 million, compared to S$116 million in the previous year.
- This was largely driven by a substantial increase in allowances for non-impaired assets, particularly in 2Q23.
- Total allowances for 2Q23 were S$252 million, up from S$110 million in 1Q23. Compared to the previous quarter, allowances for impaired assets were 7% lower at S$52 million, while allowances for non-impaired assets climbed from S$54 million to S$200 million. The increase in allowances for non-impaired assets reflected:
- Changes in risk profiles in the loan portfolio;
- Updates of macro-economic variables in the Expected Credit Loss (“ECL”) model; and
- Management overlays for specific risk segments, including the commercial real estate sector in developed markets
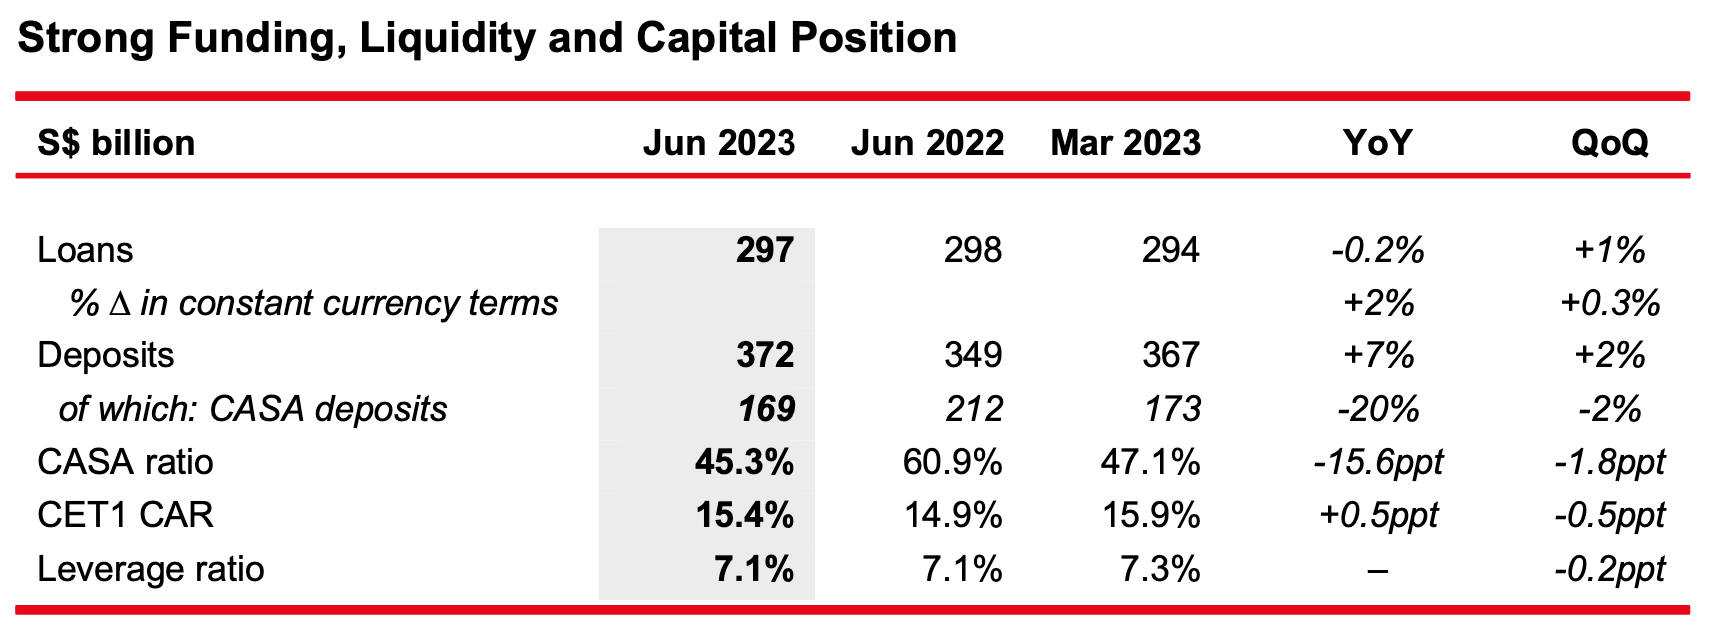
- As at 30 June 2023, customer loans were S$297 billion, up 2% from the previous year on a constant currency basis, mainly from corporate and housing loans. By geography, the year-on-year increase in loans was led by a rise in Singapore, Australia, the United States and United Kingdom.
- Sustainable financing loans grew 29% from a year ago to S$33.6 billion. Total loan commitments were S$47.4 billion as at 30 June 2023, on track to achieve the Group’s target of S$50 billion by 2025.
- Customer deposits rose 7% year-on-year to S$372 billion, driven by sustained inflows of fixed deposits, which led to a drop in the CASA ratio to 45.3%. Loans-to-deposits ratio was 78.8%, compared to 84.4% a year ago and 79.2% in the last quarter.
- Group CET1 CAR was 15.4%, while the leverage ratio was 7.1% as at 30 June 2023.
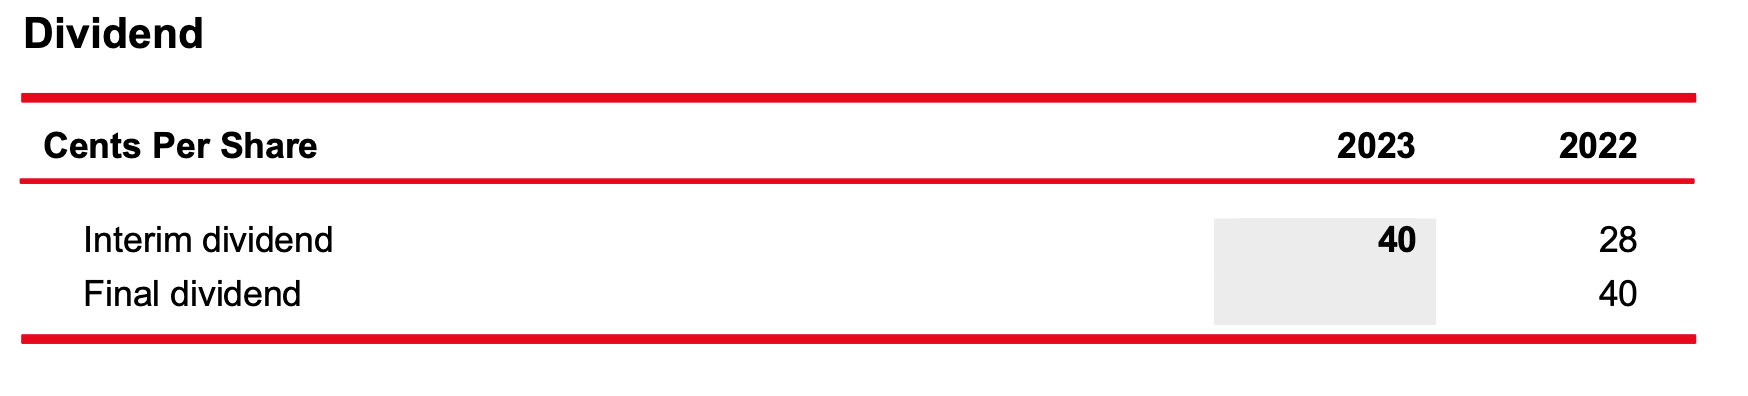
- An interim dividend of 40 cents per share has been declared, up 43% or 12 cents from a year ago.
- The interim dividend payout will amount to S$1.80 billion, representing a payout ratio of 50%.
- The Scrip Dividend Scheme will not be applicable to the interim dividend.
Message from Group CEO, Helen Wong
“We have delivered a robust set of results for the first half of 2023. The Group achieved record net profit, which crossed the S$3 billion mark for the first time on the back of strong contributions from the Group’s banking, wealth management and insurance franchise. With the resilient performance and OCBC’s strong capital position, we are pleased to raise the interim dividend by 43% or 12 cents from a year ago to 40 cents, representing a payout ratio of 50%.
Our sustainability journey is progressing well. This year, we unveiled our sectoral decarbonisation targets, demonstrating our firm commitment to achieving net zero by 2050. Our sustainable financing commitments have crossed S$47 billion, and we are on track to achieve our target of S$50 billion by 2023, two years ahead of schedule. We were recognised as the Best Bank for Sustainable Finance in Singapore by Global Finance in July 2023.
To solidify our One Group approach to capturing growth opportunities, we have recently launched a unified brand and logo across our core markets, as well as a new tagline: For now, and beyond. We are committed to leveraging the combined strength of our strong network and enhancing our One Group capabilities to drive the medium-term growth initiatives that we have identified. At the same time, we will continue to be prudent in our risk and capital management given the uncertain global economic outlook.”