Top Fund
May 2024
Top Fund Ideas For 2Q2024
PIMCO GIS Income Fund
Seeking high current income
MSCI ESG Rating: Nil
Suitable for:
The Income Fund is a portfolio that is actively managed and utilizes a broad range of fixed income securities that seek to produce an attractive level of income while maintaining a relatively low risk profile, with a secondary goal of capital appreciation.
The significant sell-off in bond yields and widening of spreads provide access to attractive yields that we haven’t seen in many years, driving higher return potential for today’s investors.
With central banks likely coming to the end of the rate hiking cycle, investors should lock in attractive yields for the longer term.
Past performance (%)
| Past performance (%) | 1Y | 3Y | 5Y | Since Inception |
| E SGD- H Income1 | 5.24 | -0.46 | 1.59 | 3.02 |
| Net of 5% Fee2 | 0.02 | -2.13 | 0.55 | 2.54 |
Why we like the fund
Potentially attractive yield - The Fund has a yield-to-maturity of 7.23%1,3 and this provides additional buffer against any further increases in rates or spreads.
Diversified approach - The Fund is highly diversified with 6,000+ holdings, investing across the entire fixed income market. As we approach the later stage of the economic cycle, holding a higher quality and diversified portfolio is crucial to protect against a market selloff.
Capital preservation - Consistent income can help build returns over time, with capital gain potential when markets recover. The Fund is built for resilience under many scenarios for rates & spreads.
About the fund
| Annualised Distribution Yield | 6.41% |
| Fund inception date | 30 November 2012 |
| Fund size | US$73,711 mil |
| Unified Fee | 1.45% p.a. |
| Subscription modes | Cash Only |
Top 5 holdings (as of 31 December 2023)
| % | |
| FNMA TBA 6.0% JAN 30YR | 4.49 |
| FNMA TBA 5.5% JAN 30YR | 4.08 |
| FNMA TBA 6.5% FEB 30YR | 3.94 |
| FNMA TBA 5.0% JAN 30YR | 3.88 |
| FNMA TBA 3.5% FEB 30YR | 3.74 |
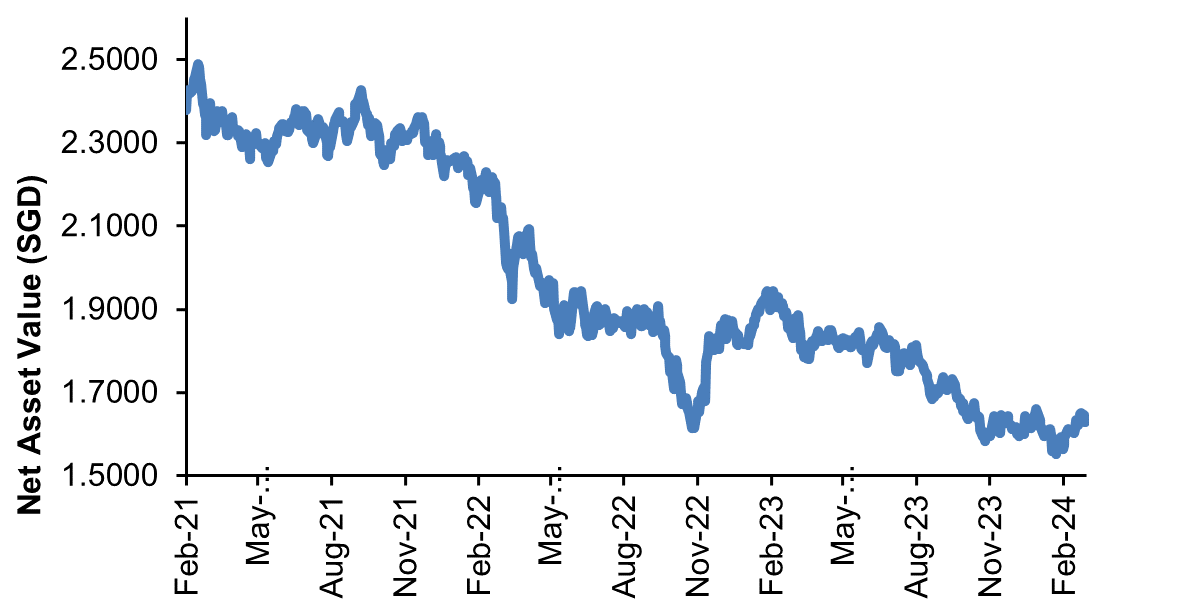
NAV movement1
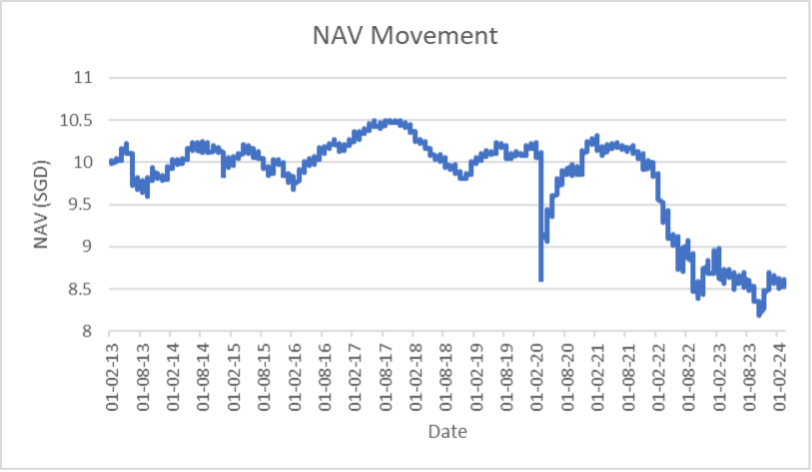
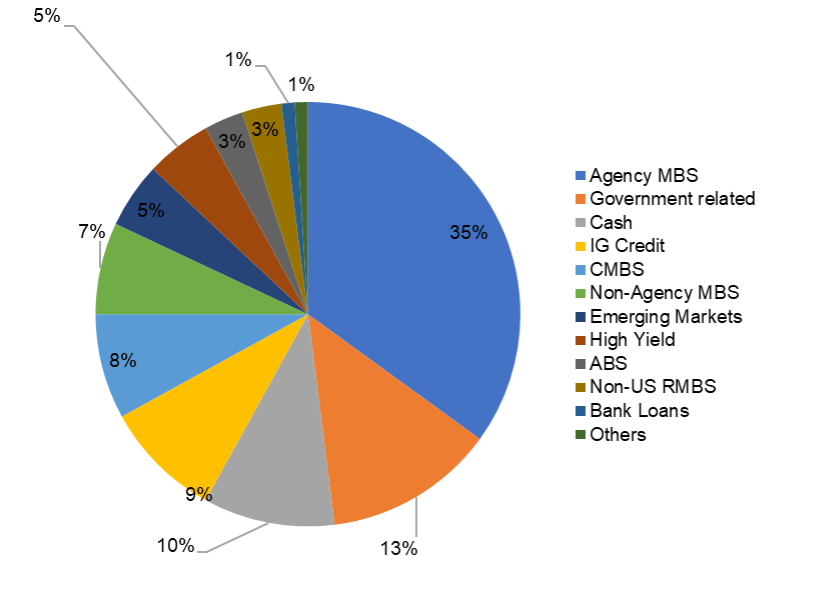
Source: NAV chart based on PIMCO data as at 22 March 2024; fund information extracted from PIMCO as at 29 February 2024.
Sector allocation
Fund performance figures are extracted from PIMCO for the E SGD- Hedged Income share class. These figures are as at 29 February 2024, on a single pricing basis with no realisation charge, on the assumption that all dividends and distributions are reinvested taking into account all charges payable upon such reinvestment, if any. 1These figures exclude subscription fee. 2These figures include a 5% subscription fee. Performance figures exceeding 1 year, if any, were stated on an average annual compounded basis. Past performance figures do not reflect future performance.
3PIMCO calculates a Fund's Estimated Yield to Maturity by averaging the yield to maturity of each security held in the Fund on a market weighted basis. PIMCO sources each security's yield to maturity from PIMCO's Portfolio Analytics database. When not available in PIMCO's Portfolio Analytics database, PIMCO sources the security's yield to maturity from Bloomberg. When not available in either database, PIMCO will assign a yield to maturity for that security from a PIMCO matrix based on prior data. The source data used in such circumstances is a static metric and PIMCO makes no representation as to the accuracy of the data for the purposes of calculating the Estimated Yield to Maturity. The Estimated Yield to Maturity is provided for illustrative purposes only and should not be relied upon as a primary basis for an investment decision and should not be interpreted as a guarantee or prediction of future performance of the Fund or the likely returns of any investment.
Amundi Funds Asia Income ESG Bond
Reinforce your income sustainably for the future
MSCI ESG Rating: A
Suitable for:
The outlook on Asian fixed Income is positive thanks to positive growth-inflation dynamics and a more supportive external backdrop.
The upcoming elections in India will be closely observed for any potential affect on geopolitical hazard, but a recovery in Asian tourism, an expected diminish in US Treasury yields in late-2024 with credit spreads remaining steady, which are drivers of Asian Corporate bonds.
The market for green, social, sustainability, and sustainability-linked (GSSS) bonds is growing rapidly. Asia is responsible for an increasingly large share of overall issuance in this segment. There is increasing evidence that ESG factors have an impact on risk and returns. Investing responsibly is key to mitigating ESG risks.
Past performance
| Past performance (%) | 1Y | 3Y | 5Y | Since Inception |
| A USD (C)1 | N.A. | N.A. | N.A. | 2.08 |
| Net of 4.5% Fee2 | N.A. | N.A. | N.A. | 2.32 |
Why we like the fund
Potential for high income - Yields in Asian bonds are at their highest levels in years which offers investors the potential to achieve a higher level of total returns over time. Within Asia, we see opportunities within the specialised financial and consumer cyclical issuers.
Flexibility to adapt in any market condition – The fund can invest in both investment-grade and high-yield bonds to capture opportunities in Asia and adjusts its allocation actively to adapt to the changing market environment.
Innovative ESG framework – The fund’s GSSS bond exposure is spread across a variety of sectors including but not limited to utilities, financials, consumer, telecommunication, and government-related sectors. In particular, there are opportunities within the renewables space in Asia given the overall green push and supportive government policies.
About the fund
| Past 12M Dividend Yield | N.A |
| Fund inception date | 6 December 2023 |
| Fund size2 | US$51.85 mil |
| Annual management fee | 1.15% p.a. |
| Subscription modes | Cash Only |
Top 5 holdings
| % | |
| Indonesia | 5.65 |
| Hong Kong | 4.83 |
| Asian Development bank | 3.76 |
| International Finance Corp | 3.76 |
| EBRD – European BK Reconst DVP | 2.97 |
NAV movement1

Source: NAV chart based on Bloomberg data as at 29 February 2024; fund information extracted from the fund’s factsheet provided by Amundi Asset Management as at 29 February 2024.
Asset allocation

Fund performance figures are extracted from Amundi Asset Management for the A USD (C) share class. These figures are as at 29 February 2024, on a single pricing basis with no realisation charge, on the assumption that all dividends and distributions are reinvested taking into account all charges payable upon such reinvestment, if any. 1These figures exclude subscription fee. 2These figures include a 4.5% subscription fee. Performance figures exceeding 1 year, if any, were stated on an average annual compounded basis. Past performance figures do not reflect future performance.
Allianz Income and Growth
Position for income and potential growth
MSCI ESG Rating: AA
Suitable for:
2023’s economic momentum is expected to carry over into 2024, but conflicting factors make it difficult to predict a path with certainty.
Changes in any of the macro conditions will likely influence investor sentiment, causing equity market volatility over the course of the year. High-yield credit and convertible securities should be better positioned to weather market volatility given current market dynamics, which in some respects are more favourable today than they were exiting 2022.
Consequently, today’s market outlook resembles 2023’s with mid to high single-digit returns possible by year-end 2024 for high-yield credit, convertible securities, and equities.
Past performance1
| Past performance (%) | 1Y | 3Y | 5Y | Since Inception |
| AT USD1 | 15.97 | 1.52 | 7.41 | 7.54 |
| Net of 5% Fee2 | 10.17 | -0.20 | 6.32 | 7.09 |
Why we like the fund
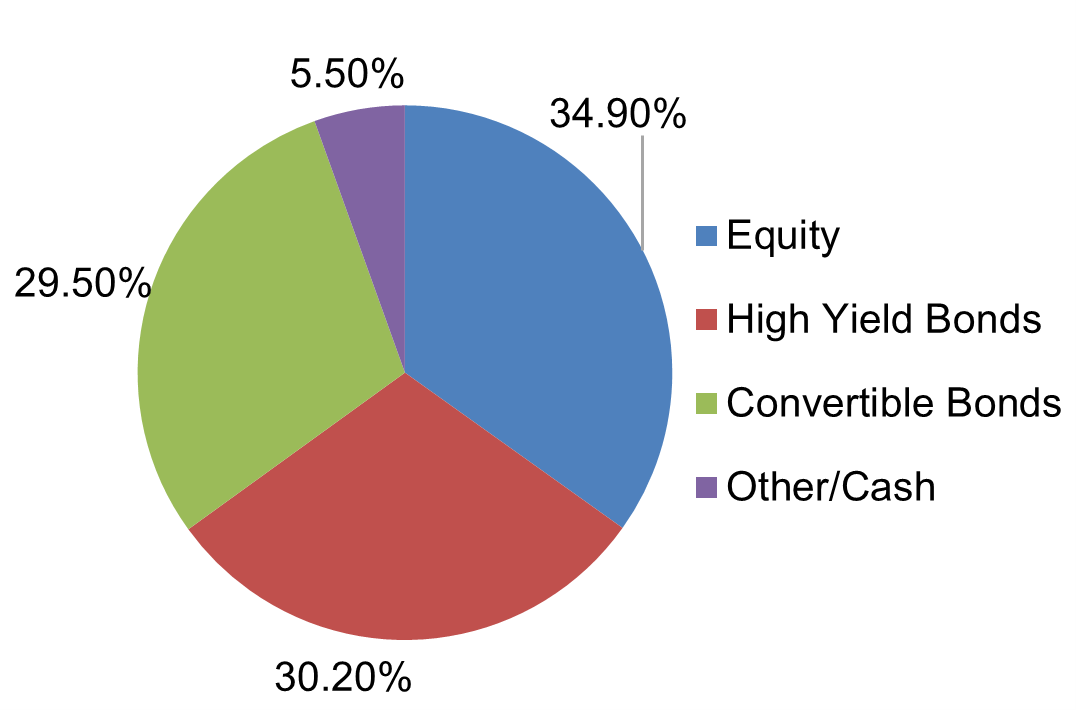
A diversified 3-sleeve approach – The fund adopts a “three-sleeves” approach, with the core holdings invested primarily in a portfolio consisting of 1/3 US high-yield bonds, 1/3 US convertible bonds and 1/3 US equities/equity securities.
Position for income and potential growth – The three-sleeves approach has historically provided investors with good upside participation potential and lower downside risk compared to pure equity.
Targeted monthly dividend – The fund aims to provide a stable income stream regardless of NAV fluctuations.
About the fund
| Past 12M Dividend Yield | 7.35% |
| Fund inception date | 18 November 2011 |
| Fund size | US$46,467.77 mil |
| Annual management fee | 1.25% p.a. |
| Subscription modes | Cash and SRS Only |
Top 5 holdings
| % | |
| Microsoft Corp | 2.00 |
| Amazon.com Inc | 2.00 |
| NVIDIA Corp | 1.40 |
| Alphabet Inc – Cl A | 1.30 |
| Salesforce Inc | 1.00 |
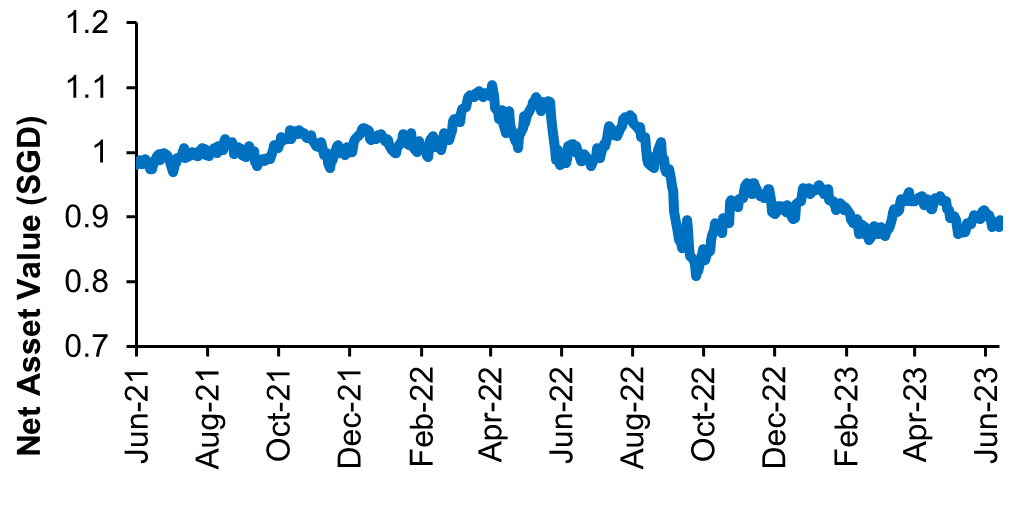
NAV movement1

Source: NAV chart based on Pico as at 29 February 2024; fund information extracted from the fund’s factsheet provided by AllianzGI as at 29 February 2024.
Asset allocation
Fund performance figures are extracted from Allianz Global Investors for the AT USD share class. These figures are as at 29 February 2024, on a single pricing basis with no realisation charge, on the assumption that all dividends and distributions are reinvested taking into account all charges payable upon such reinvestment, if any. 1These figures exclude subscription fee. 2These figures include a 5% subscription fee. Performance figures exceeding 1 year, if any, were stated on an average annual compounded basis. Past performance figures do not reflect future performance.
Allianz Global Sustainability
Investing in ESG leaders
MSCI ESG Rating: AA
Suitable for:
Global sustainability challenges are introducing new risks for investors, and modern investors may seek to re-evaluate traditional approaches to investment. As Environmental, Social and Governance (ESG) grows in significance, fund flows into sustainable investing has seen sustained increase year-on-year. The impressive advancement has been mainly driven by institutional investors, and we have also seen increasing interest from retail investors.
Companies prioritising ESG factors are becoming increasingly attractive to investors as they may potentially generate superior long-term financial performance.
We believe that integrating ESG factors in the investment decision making process will help investors mitigate certain risks and improve the quality of their portfolios.
Past performance1
| Past performance (%) | 1Y | 3Y | 5Y | Since Inception |
| A EUR Dis.1 | 16.85 | 10.53 | 11.62 | 7.73 |
| Net of 5% Fee2 | 11.00 | 8.66 | 10.48 | 7.47 |
Why we like the fund
Best-in-class approach to sustainable and responsible investing (SRI) – The fund focuses on high conviction Sustainable Responsible Investment (SRI) investments and integrates ESG assessment of prospective investments, focusing on companies with solid aspects of ESG and financial characteristics.
Resilience in diversification – The fund has exposure to a global portfolio of quality stocks with sustainable growth at reasonable valuations.
Generating competitive and sustainable income – The fund focuses on high quality companies generating returns sustainably above the cost of capital, with a clear growth trajectory, on reasonable valuations.
About the fund
| Past 12M Dividend Yield | 2.53%3 |
| Fund inception date | 2 January 2003 |
| Fund size | €2,576.80 mil |
| Annual management fee | 1.50% p.a. |
| Subscription modes | Cash / SRS (only for the SGD share classes) |
Top 5 holdings
| % | |
| Microsoft Corp | 7.40 |
| UnitedHealth Group Inc | 3.70 |
| Visa Inc – Class A Shares | 3.30 |
| Intuit Inc | 3.10 |
| Medtronic PLC | 3.00 |
NAV movement1
Source: NAV chart based on Pico as at 29 February 2024; fund information extracted from the fund’s factsheet provided by AllianzGI as at 29 February 2024.
Sector allocation

Fund performance figures are extracted from Allianz Global Investors for the A EUR Dis. share class. These figures are as at 29 February 2024, on a single pricing basis with no realisation charge, on the assumption that all dividends and distributions are reinvested taking into account all charges payable upon such reinvestment, if any. 1These figures exclude subscription fee. 2These figures include a 5% subscription fee. Performance figures exceeding 1 year, if any, were stated on an average annual compounded basis. Past performance figures do not reflect future performance. 3Past payout yields do not represent future payout yields and payments. Historical payments may comprise of distributable income or capital, or both (for further details, please refer to AllianzGI’s website). Annualised Dividend Yield = [(1 + Dividend Per Share / Ex-Dividend Date NAV)¹² - 1] X 100. The annualised dividend yield is calculated based on the latest dividend distribution with dividend reinvested, and may be higher or lower than the actual annual dividend yield. Positive distribution yield does not imply positive return. Dividend is not guaranteed. Historical dividend yield is not indicative of future dividend payouts.
AB Low Volatility Equity Portfolio
Seeks to deliver high quality and stability at an attractive price
Morningstar Rating: AA
Suitable for:
Equity portfolios designed to smooth volatility are especially appealing in the current market environment and companies that offer a combination of quality and stability at attractive prices are investments that ride through near-term uncertainty.
In the long-term, companies with these features are best positioned to deliver strong returns through changing environments and emerge as winners later.
Past performance1
Past performance (%)
1Y
3Y
5Y
Since Inception
Class A USD1
23.49
9.60
9.01
9.67
Net of 4% Fee2
18.56
8.11
8.12
9.26
Why we like the fund
Healthy returns with low volatility – The investment team selects a portfolio of global equities that appear to be of high quality, have low volatility and reasonable valuations, and offer attractive shareholder returns.
Experienced and well-resourced Investment team – The team has decades of combined experience. As bottom-up stock prickers we focus on fundamental research and analysis, drawing on firmwide expertise of AB’s investment specialists to identify the best businesses across the world.
Potential to grow your capital – The Portfolio aims to increase the value of your investment over time through capital growth.
About the fund
Past 12M Dividend Yield (Class AD USD)
3.38%3
Fund inception date
11 December 2012
Fund size
US$5,975.73 mil2
Annual management fee
1.50% p.a.
Subscription modes
Cash Only
Top 5 holdings3
%
Microsoft Corp.
5.54
Broadcom, Inc.
3.19
Alphabet, Inc.
2.97
Apple, Inc.
2.53
Novo Nordisk A/S
2.28
NAV movement4

Sector allocation3

Fund performance figures are extracted from AllianceBernstein for the Class A USD share class. These figures are as at 29 February 2024, on a single pricing basis with no realisation charge, on the assumption that all dividends and distributions are reinvested taking into account all charges payable upon such reinvestment, if any. 1These figures exclude subscription fee. 2These figures include a 4% subscription fee. Performance figures exceeding 1 year, if any, were stated on an average annual compounded basis. Past performance figures do not reflect future performance.
Source: 3Fund information extracted from the fund’s factsheet provided by AB as at 29 February 2024, 4 NAV chart sourced from AB as at 29 February 2024.
Past performance1
| Past performance (%) | 1Y | 3Y | 5Y | Since Inception |
| Class A USD1 | 23.49 | 9.60 | 9.01 | 9.67 |
| Net of 4% Fee2 | 18.56 | 8.11 | 8.12 | 9.26 |
Why we like the fund
Healthy returns with low volatility – The investment team selects a portfolio of global equities that appear to be of high quality, have low volatility and reasonable valuations, and offer attractive shareholder returns.
Experienced and well-resourced Investment team – The team has decades of combined experience. As bottom-up stock prickers we focus on fundamental research and analysis, drawing on firmwide expertise of AB’s investment specialists to identify the best businesses across the world.
Potential to grow your capital – The Portfolio aims to increase the value of your investment over time through capital growth.
About the fund
| Past 12M Dividend Yield (Class AD USD) | 3.38%3 |
| Fund inception date | 11 December 2012 |
| Fund size | US$5,975.73 mil2 |
| Annual management fee | 1.50% p.a. |
| Subscription modes | Cash Only |
Top 5 holdings3
| % | |
| Microsoft Corp. | 5.54 |
| Broadcom, Inc. | 3.19 |
| Alphabet, Inc. | 2.97 |
| Apple, Inc. | 2.53 |
| Novo Nordisk A/S | 2.28 |
NAV movement4
Sector allocation3
Fund performance figures are extracted from AllianceBernstein for the Class A USD share class. These figures are as at 29 February 2024, on a single pricing basis with no realisation charge, on the assumption that all dividends and distributions are reinvested taking into account all charges payable upon such reinvestment, if any. 1These figures exclude subscription fee. 2These figures include a 4% subscription fee. Performance figures exceeding 1 year, if any, were stated on an average annual compounded basis. Past performance figures do not reflect future performance.
Source: 3Fund information extracted from the fund’s factsheet provided by AB as at 29 February 2024, 4 NAV chart sourced from AB as at 29 February 2024.
LionGlobal Japan Growth Fund SGD-H
The Japanese Comeback
MSCI ESG Rating: AA
Suitable for:
Given the Bank of Japan’s statement that accommodative financial conditions will be maintained, we believe this dovish outlook is expected to provide assurance to the Japanese equity market.
Investors looking to invest in Japanese equities should consider investing on an unhedged FX basis. Currency movements will impact different sectors, with a stronger JPY being a drag on companies that are dependent on overseas demand, and a benefit to domestic oriented companies with USD cost bases. Japanese banks and life insurance companies are direct beneficiaries of higher interest rates, but the positives are likely priced In. Domestic-oriented Japanese companies are expected to benefit from stronger consumer spending and eventual FX tailwinds. Longer-term ideas include companies exposed to generative AI and industrial automation.
Past performance1
| Past performance (%) | 1Y | 3Y | 5Y | Since Inception |
| SGD-H1 | 37.0 | 14.5 | 14.5 | 11.8 |
| Net of 5% Fee2 | 30.2 | 12.5 | 13.3 | 11.2 |
Why we like the fund
De-risking from China – Reshoring efforts by the G7 economies to friendlier economies within the Asia Pacific is favourable for Japan.
Corporate governance restructuring – The Tokyo Stock Exchange has requested companies trading below price-to-book of 1x to improve valuations by restructuring businesses is a significant policy that can improve share prices.
Deflation to inflation – Japan’s economy is facing a sustained period of inflation that is forcing companies to hike wages, thus spurring consumers to spend more in an inflationary environment.
About the fund
| Past 12M Dividend Yield | N.A. |
| Fund inception date | 3 December 1999 |
| Fund size | S$215.3 mil |
| Annual management fee | 1.4% p.a. |
| Subscription modes | Cash, CPFIS-OA, SRS |
Top 5 holdings
| % | |
| MIZUHO FINANCIAL GROUP INC | 2.9 |
| SONY GROUP CORP | 2.9 |
| DENSO CORP | 2.1 |
| KEYENCE CORP | 2.0 |
| HITACHI LTD | 1.9 |
NAV movement1

Source: NAV chart based on Bloomberg data as at 29 Febuary 2024; fund information extracted from the fund’s factsheet provided by Lion Global Investors as at 29 February 2024.
Sector allocation

Fund performance figures are extracted from Lion Global Investors for the SGD-H share class. These figures are as at 31 March 2024, on a single pricing basis with no realisation charge, on the assumption that all dividends and distributions are reinvested taking into account all charges payable upon such reinvestment, if any. 1These figures exclude subscription fee. 2These figures include a 5% subscription fee. Performance figures exceeding 1 year, if any, were stated on an average annual compounded basis. Past performance figures do not reflect future performance.
FSSA Dividend Advantage Fund
Capturing the Asian growth story
MSCI ESG Rating: A
Suitable for:
Looking ahead for Asia, investors will likely focus on the 1Q24 results season, elections (e.g. India which will hold its elections from 19 April in seven phases), potential start of rate cuts by some major central banks including the US Federal Reserve and policy implementation, particularly from China.
In terms of earnings trajectory, the MSCI Asia ex-Japan Index is projected to deliver EPS growth of 20% in 2024 (based on Bloomberg’s bottom-up consensus median estimates), which could be overly optimistic. Markets which are expected to achieve stronger earnings growth include South Korea, Taiwan and India, while slower growth is expected to come from Indonesia, Hong Kong and Singapore.
Past performance1
| Past performance (%) | 1Y | 3Y | 5Y | Since Inception |
| Class A (SGD – Q Dist)1 | -7.0 | -7.3 | 1.5 | 7.4 |
| Net of 5% Fee2 | -11.7 | -8.9 | 0.4 | 7.1 |
Why we like the fund
Diversified exposure in the Asian region – The fund offers broad exposure towards China, India and ASEAN equities, allowing investors to benefit from the growth trends in the region.
Preference for quality companies – The fund adopts a bottom-up selection methodology to identify high quality companies with sustainable and predictable growth to invest for the long term.
Proven track record – In a low real interest rate environment, this fund appeals to investors who are looking for yield; it pays a quarterly dividend of approximately 4% p.a.
About the fund
| Past 12M Dividend Yield | 4.01% |
| Fund inception date | 20 December 2004 |
| Fund size | S$4,633.7 mil |
| Annual management fee | 1.50% p.a. |
| Subscription modes | Cash/SRS/CPF–OA |
Top 5 holdings
| % | |
| HDFC Bank | 8.5 |
| Taiwan Semiconductor (TSMC) | 8.4 |
| Midea Group | 5.2 |
| Tencent Holdings Ltd. | 4.8 |
| ICICI Bank Limited | 4.1 |
NAV movement1
Source: NAV chart based on Lipper data as at 29 Feb 2024; fund information extracted from the fund’s factsheet provided by First Sentier Investors as at 29 Feb 2024.
Sector allocation

Fund performance figures are extracted from First Sentier Investors for the Class A SGD – Q Dist share class. These figures are as at 29 February 2024, on a single pricing basis with no realisation charge, on the assumption that all dividends and distributions are reinvested taking into account all charges payable upon such reinvestment, if any. 1These figures exclude subscription fee. 2These figures include a 5% subscription fee. Performance figures exceeding 1 year, if any, were stated on an average annual compounded basis. Past performance figures do not reflect future performance.