Wealth Panel Insights 5
November 2020
Markets versus polls: Are we missing something?
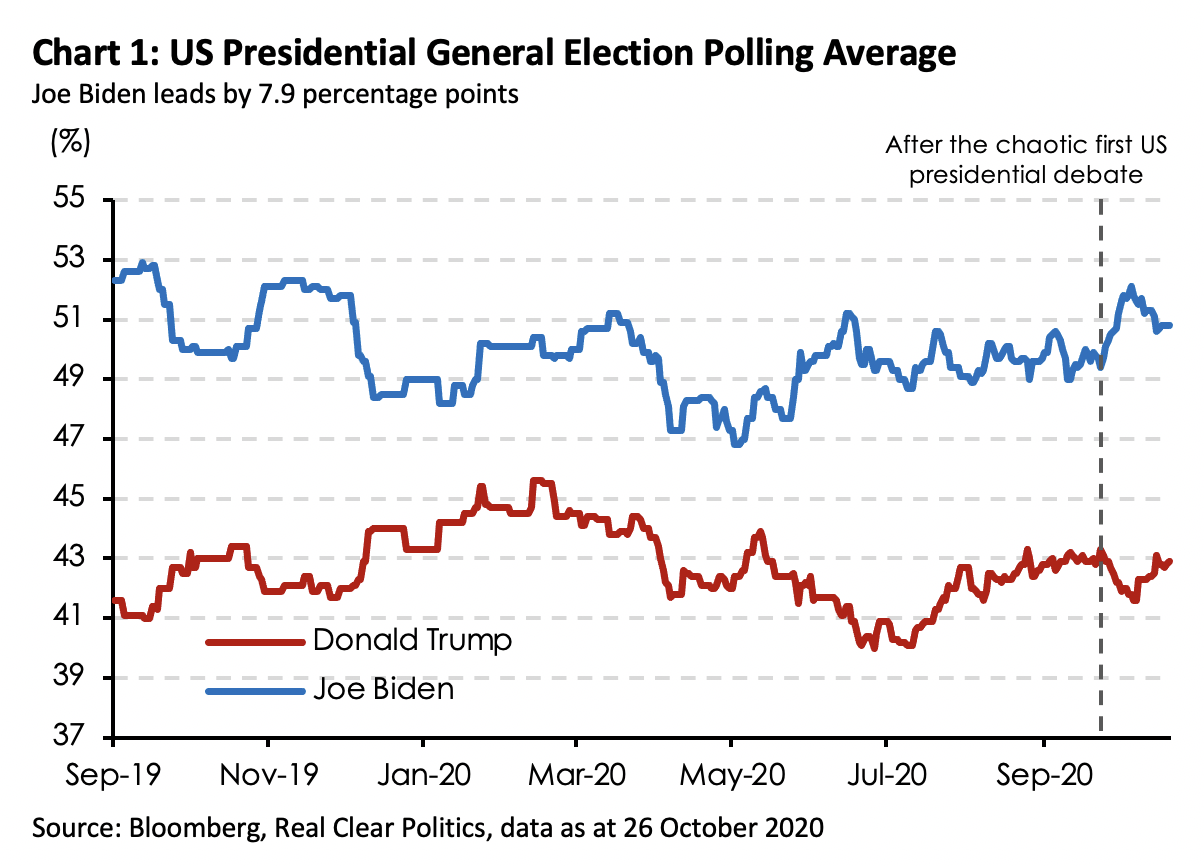
Polls and betting markets predict a Biden victory
Former Vice-President and Democratic presidential candidate, Joe Biden, continues to lead President Donald Trump in both the national polls and prediction markets, although that lead has diminished slightly after President Trump’s return to the campaign trail. According to the Real Clear Politics average general election polling, Joe Biden enjoys a 7.9-percentage point lead against his Republican rival.
Yet, the presidential election is not determined by the national popular vote, but by the electoral college. As such, assessing individual polls across battleground states like Wisconsin, Michigan, Pennsylvania, North Carolina, Florida and Arizona is essential to ascertain if Biden also enjoys an electoral college advantage, in addition to a national polling lead.
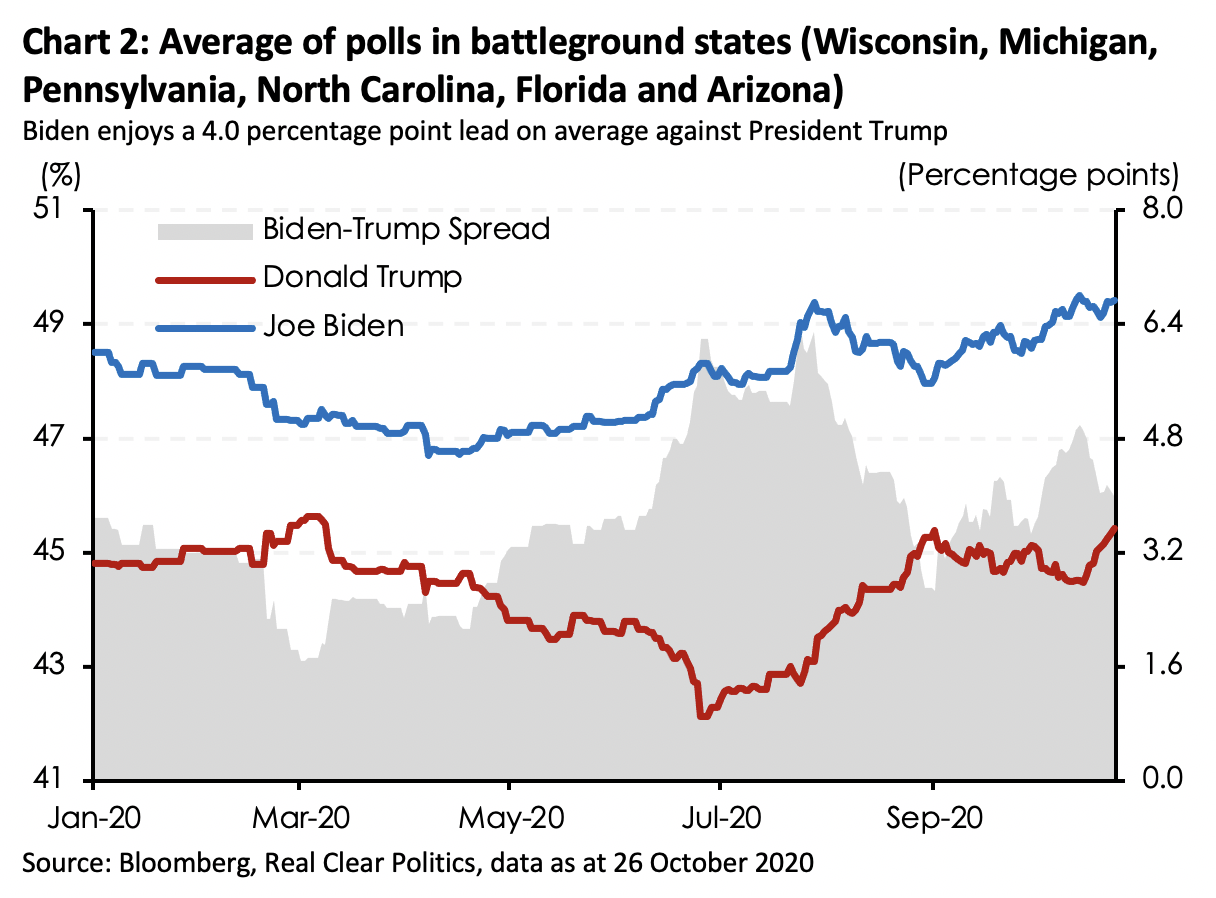
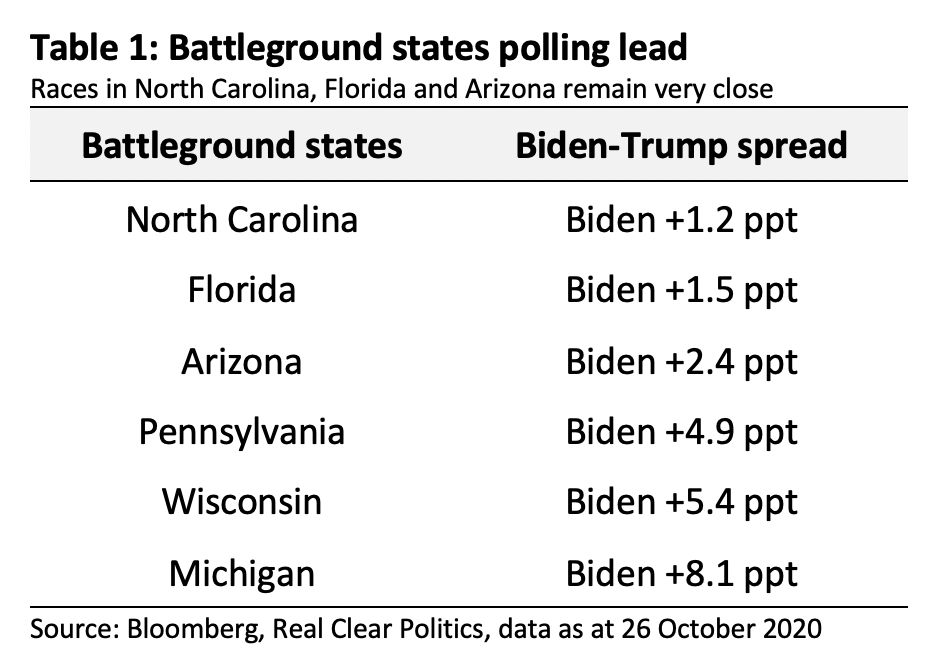
And to some degree, he does. Biden leads President Trump by 4.0 percentage points on average in the above mentioned six battleground states. On closer inspection, Biden’s lead has started to narrow, and the race is definitely closer in these states than national polls suggest. So, while he may be in the lead now, it might not necessarily remain that way. There is always a risk these states may upset the polls.
Perhaps Biden may avoid the Clinton curse
At this point in the race in 2016, Hillary Clinton was up against Donald Trump by 5.4 percentage points nationally. Unfortunately, her lead steadily dwindled as election day approached, such that her polling numbers fell well within the margin of error by election day, especially across battleground states like Pennsylvania, Michigan and Wisconsin.
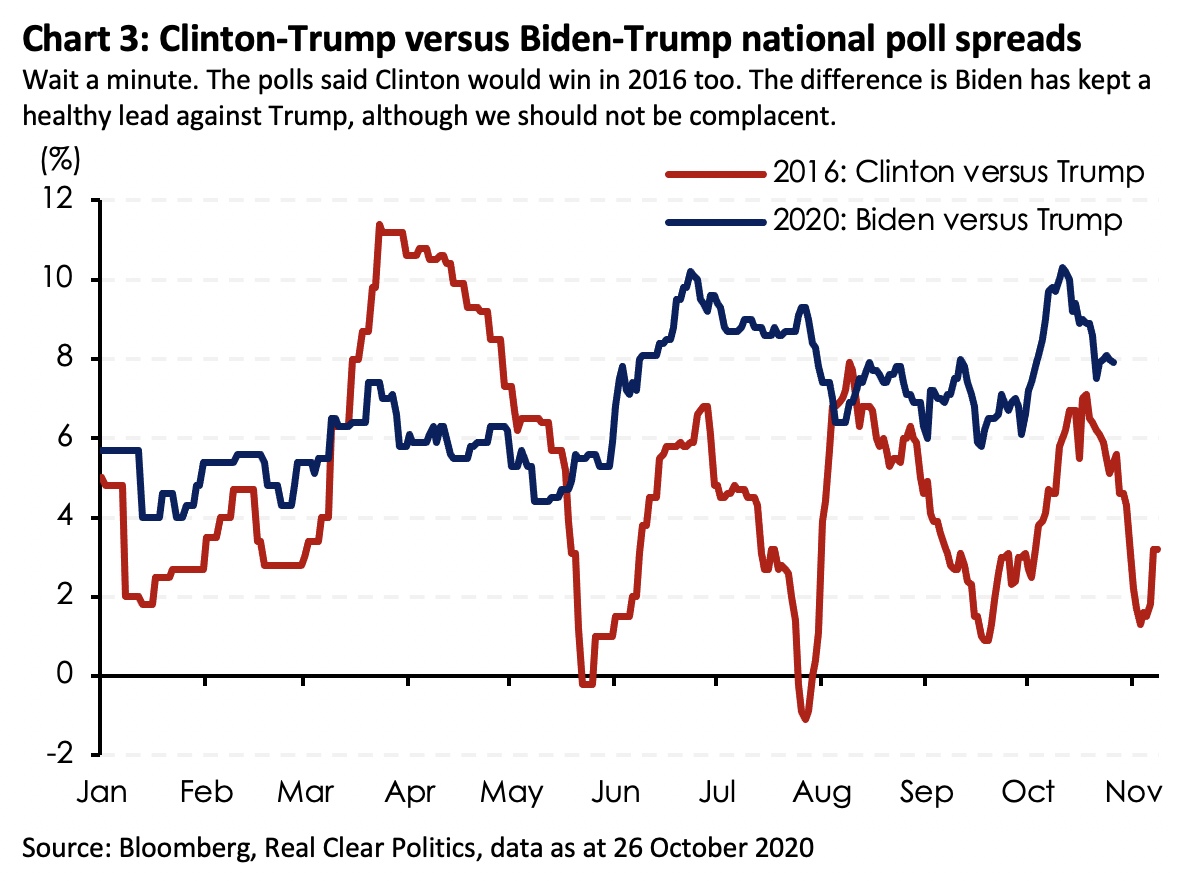
Perhaps Joe Biden may avoid the Clinton curse after all, given that his support has been relatively stable. As can be gleaned from Chart 3, Hillary Clinton’s margin over Donald Trump was fairly volatile, swinging as much as 12.5 percentage points from the peak to the trough of the polls over the course of the race. By contrast, Joe Biden has enjoyed a steady and consistent lead against his opponent, with a variance of about 8 points from the top to the bottom of the polls during this election cycle. Notice also that his lead against Donald Trump has stayed consistently above 4 percentage points throughout the course of the race and that his national poll numbers continue to hover above 50%, unlike Hillary Clinton whose poll numbers rarely exceeded 50.
In addition, the wave of early voting would have already “locked in” some of these voter preferences at the ballot box. According to the US Elections Project, over 60 million early votes have been cast, which represents about 44.2% of the total votes counted in the 2016 general election. With slightly more than a week to the election, this number is expected to swell.
In addition, the share of undecided voters this election cycle is considerably smaller as compared to the 2016 election. Analysis by FiveThirtyEight showed that about 13% of voters on election day and as many as 20% at earlier stages of the election campaign in 2016 were either undecided or said they planned to vote for third-party candidates. This meant that Hillary Clinton’s lead against Donald Trump in the national polls was much more fragile than people had initially expected. These undecided voters broke strongly towards Donald Trump at the end of the race.
Indeed, FiveThirtyEight analysts discovered that the larger the share of undecided and third-party voters, the more volatile and less accurate the polls tend to be. By contrast, the share of undecided or third-party voters this time around is much smaller, at about 4%-6% according to various polls. This matches the 2004, 2008 and 2012 election cycles, where the outcome of the elections were fairly decisive
It certainly did not help pollsters that Hillary Clinton and Donald Trump were intensely unpopular figures, such that news events easily swayed the polls, which in part explained the volatility of their polling numbers. Then FBI director James Comey’s announcement of the reopening of investigations into Hillary Clinton’s emails around this time four years ago was among the key reasons often cited for swaying the bloc of undecided voters towards Donald Trump during the final days of the election campaign. By contrast, Joe Biden is a relatively popular figure in national politics. YouGov ranks him the fourth most popular Democrat in the US, just behind Bernie Sanders, Barack Obama and Jimmy Carter. He is especially popular among the baby boomers – the most reliable voting bloc and the most vulnerable to the Covid-19 pandemic.
Barring an eleventh-hour October surprise, perhaps the outcome may be different for Joe Biden come election day.
Covid-19 surge a death knell for Trump?
Meanwhile, the recent surge in new Covid-19 cases across the US, especially in battleground states in the mid-west, is certainly not good news for President Trump. A casual reading of Chart 4 shows that there seems to be a correlation between the probability spread of a Biden win and the 7-day moving average of new Covid-19 cases in the US. The probability of a Biden victory increases with the rise in the trend of new Covid-19 cases.
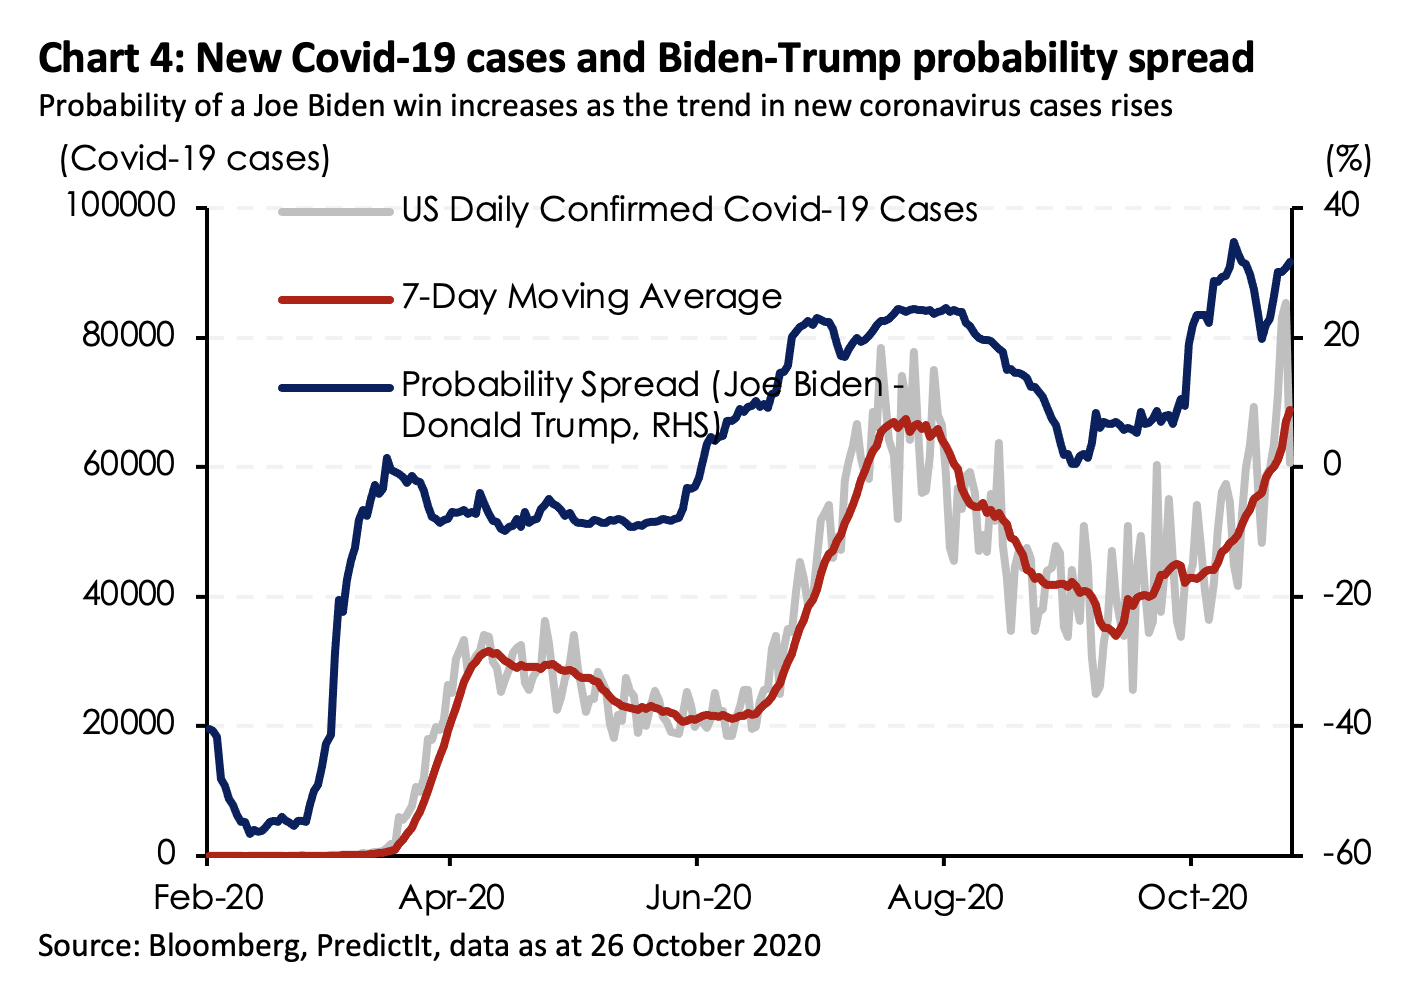
Of course, this does not necessarily imply causation. What we can say is that the Covid-19 pandemic is itself a central issue of this election cycle. As a result, the election may well be a referendum on President Trump’s handling of the Covid-19 pandemic. In line with this, the recent surge in new Covid-19 cases, hospitalisations and deaths cannot be good news for the Trump campaign and might be a hurdle in garnering support from older voters who had swung strongly towards Donald Trump in 2016.
The market seems to be singing a different tune
While polls, prediction markets and the rising Covid-19 count point in the direction of a Trump loss, stock markets seem to be predicting a different outcome. If history is a guide, the market seems to be predicting that President Trump will win re-election.
Essentially, a key observation is that a rising market 3 months before the election date tends to correlate with the presidential candidate from the incumbent party winning the election. The reverse is also true, meaning that a falling market 3 months prior to the election tends to correlate with the incumbent political party losing the race for the White House and the rival political party winning. Looking at the last 23 election cycles since 1928, this relationship bears out in 20 instances, or in about 87% of all observations. There were three elections where this relationship broke down: 1956, 1968 and 1980.
From the outset, this is purely a correlation exercise, and does not at all imply causation. As linear relationships go, the market’s prediction has been highly accurate and quite reliable.
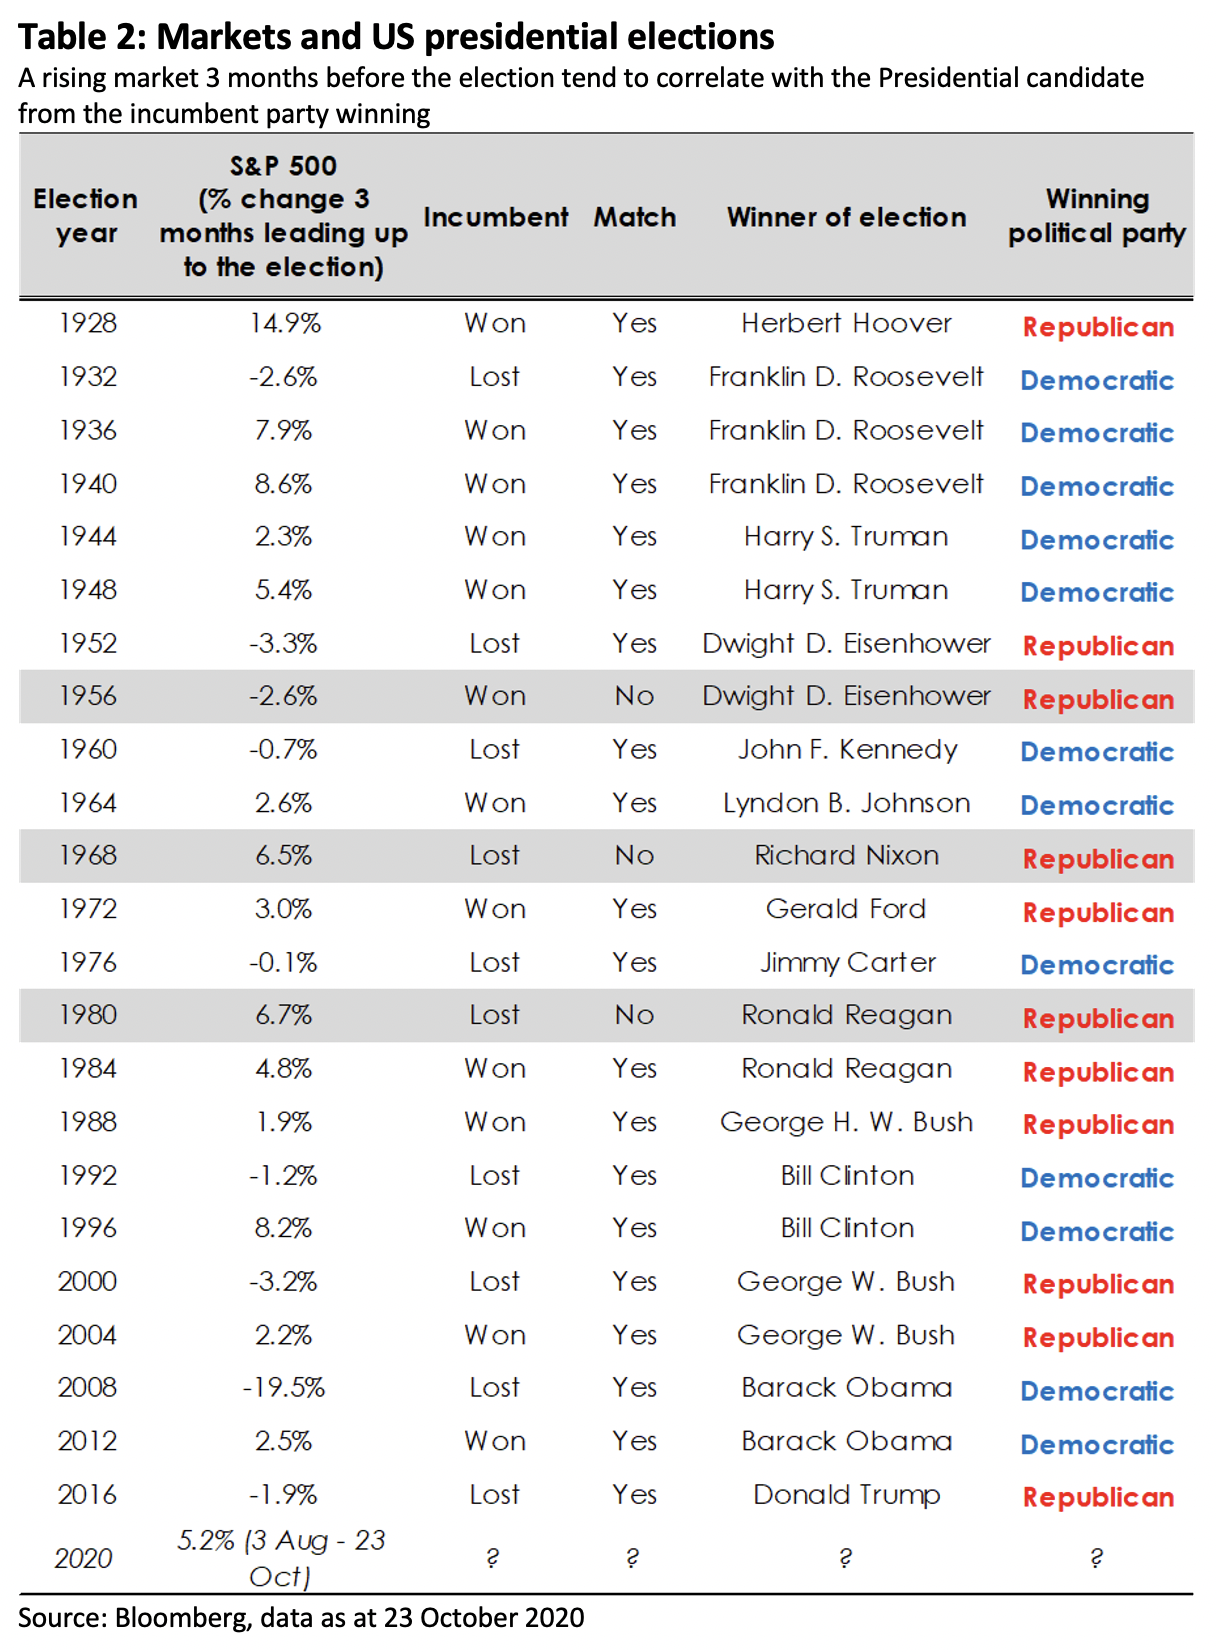
A plausible reason that could explain this linear relationship is that markets simply dislike uncertainty. It rises on expectations that there will be continuity with the incumbent political party winning the presidency, hence a less uncertain outcome. It falls on expectations that the political and policy environment may change with the ascendance of a new political party. This relationship is less about the market pricing in the long-term impact of policy proposals and more about a referendum on uncertainty versus the status quo. A change in political management represents a more uncertain outcome, and so that is the scenario that the market tends to price negatively.
The market was virtually clairvoyant in 2016. While pollsters predicted Hillary Clinton would win the close election in 2016, the markets predicted otherwise. The S&P 500 index fell 1.9% in the three months prior to the election, thereby predicting the incumbent party – the Democrats – would lose and the challenger – then-candidate Trump – would win.
Pollsters would tell you that Hillary Clinton was only marginally leading Donald Trump in national and state-wide polls just before the election in 2016, firmly placing her within the margin of error for these predictive models, which theoretically suggests the election could go either way. Despite this, many had accepted the polls at its surface value and interpreted the data in an admittedly one-sided manner. Marginal or not, Hillary Clinton was leading Donald Trump, and this meant she had the election in the bag. Hence, the surprise.
As it relates to the current election cycle, the curious observation is that the market is up about 5% three months from the date of the election. A cursory reading of this is that the market expects the incumbent, President Trump, to win.
Of course, there are about seven trading days left before the actual election date. Given how dramatically markets have swung recently, anything can happen, but we wouldn’t hold our breath. Perhaps in normal times, we could easily accept that a rising market would favour the incumbent. However, if anything, 2020 has been the antithesis of normal. It has been an exceptional year where standard relationships that we have come to depend on have broken down and where it is increasingly difficult to extract signal from noise.
Muffled market signals?
For one, this is perhaps the first time in history that the US is voting in the throes of a pandemic, with an incumbent president who has publicly stated that he may not accept a peaceful transition of power if he loses. This is also the first time that an incumbent president has so brazenly and blatantly sowed doubts about the integrity of the election process, setting the stage for a potential “Bush versus Gore” type election outcome should the race come down to the wire. This would entail rounds of vote recounts and a series of legal challenges which would prolong the uncertainty of the election.
As it stands, the unprecedented flood of mailed ballots due to the pandemic already complicates the timely tabulation of results, which means the final outcome may not be known until weeks later. President Trump’s electoral threats only exacerbates uncertainty in an already uncertain election.
Hence, the market’s concern with this election cycle may not be about the uncertainty that comes with a change in management but the fact that we could find ourselves mired in an election limbo should the race be too close to call. This could explain why markets rose as polls increasingly point to a decisive Biden victory. A clear win for Biden reduces the risk of a contested election and therefore reduces uncertainty about the election outcome, even if he represents the uncertain choice in any other conventional election cycle.
If market signals are murky, are there other points of reference from election history through which we may glean some predictive insights? One interesting observation is that presidents who oversee a recession within two years of their re-election seldom return for a second term. You’d have to stretch as far back as 1924 to be able to find an example of a president who overcame a late-in-term recession to win re-election. That was President Calvin Coolidge.
Don’t make directional bets
These points of reference might be useful in identifying the possible market scenarios that can play out this year, but they should not necessarily be the only basis of investment decisions. Investors should not time the market based on these observations, nor should they make directional bets on any particular election outcome.
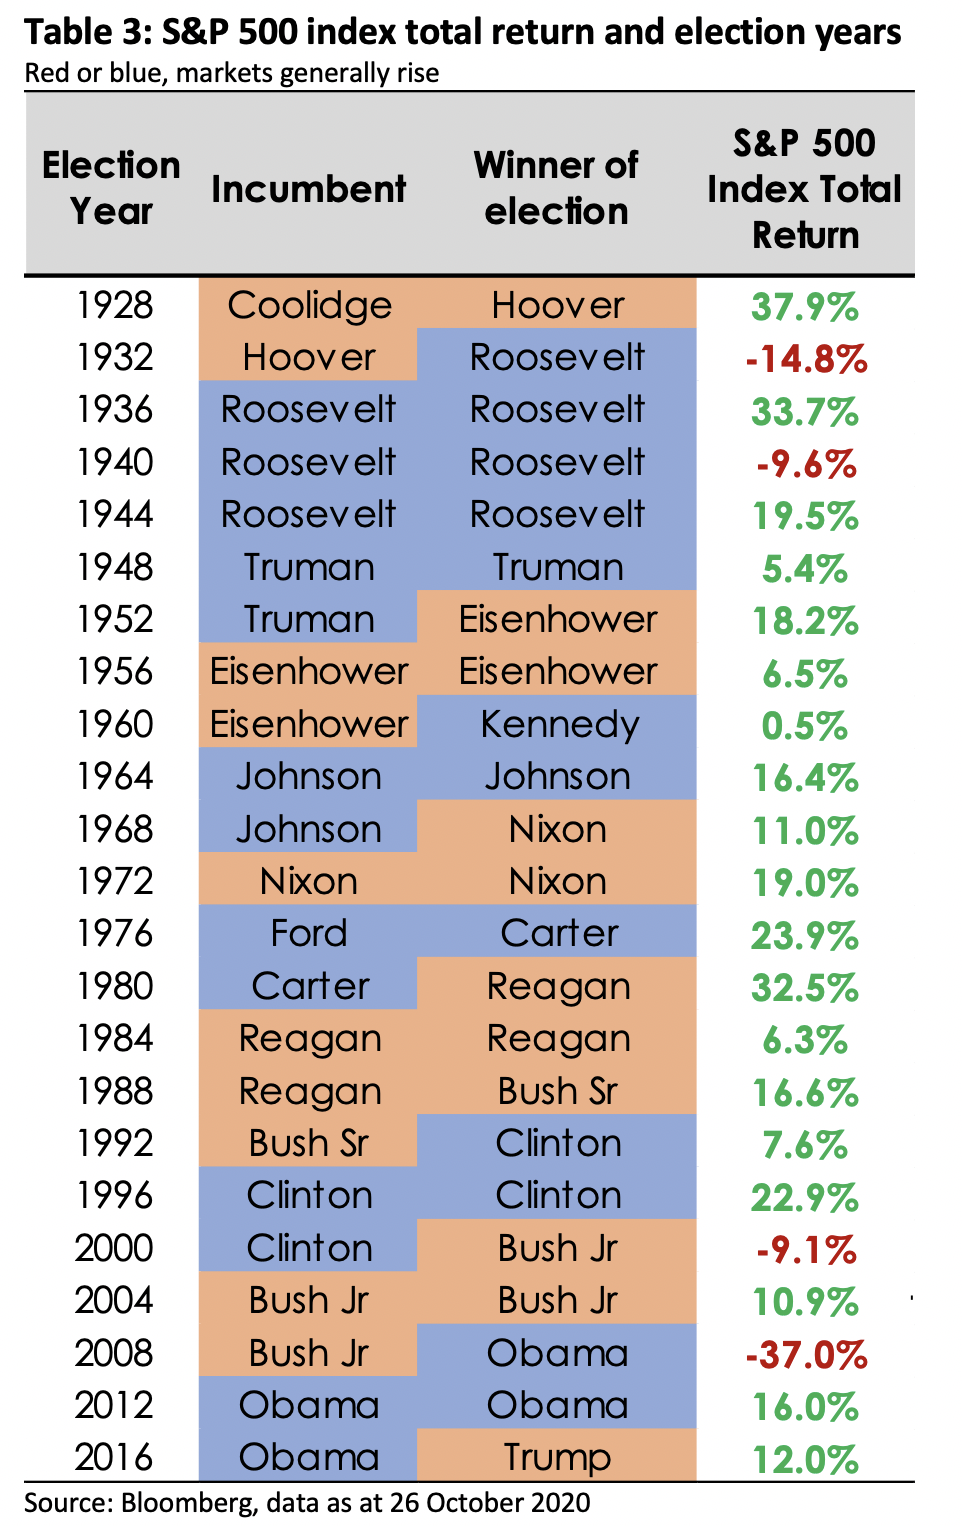
Indeed, historically stocks have performed well in election years, with the S&P 500 index posting positive annual total returns in 19 of the past 23 presidential election cycles from 1928.
Looking at the median historical market returns, we find that a unified government, where both chambers of Congress and the White House are controlled by one political party, delivers the highest return. This is followed by a split Congress and a unified Congress that is controlled by the opposite political party of the president.
Notably, the median returns are not extremely far apart. Across all scenarios, the market delivered pretty solid returns. However, this observation might not be very robust as the order of outcomes could change depending on the time frame considered and statistical metrics used (whether average or median).
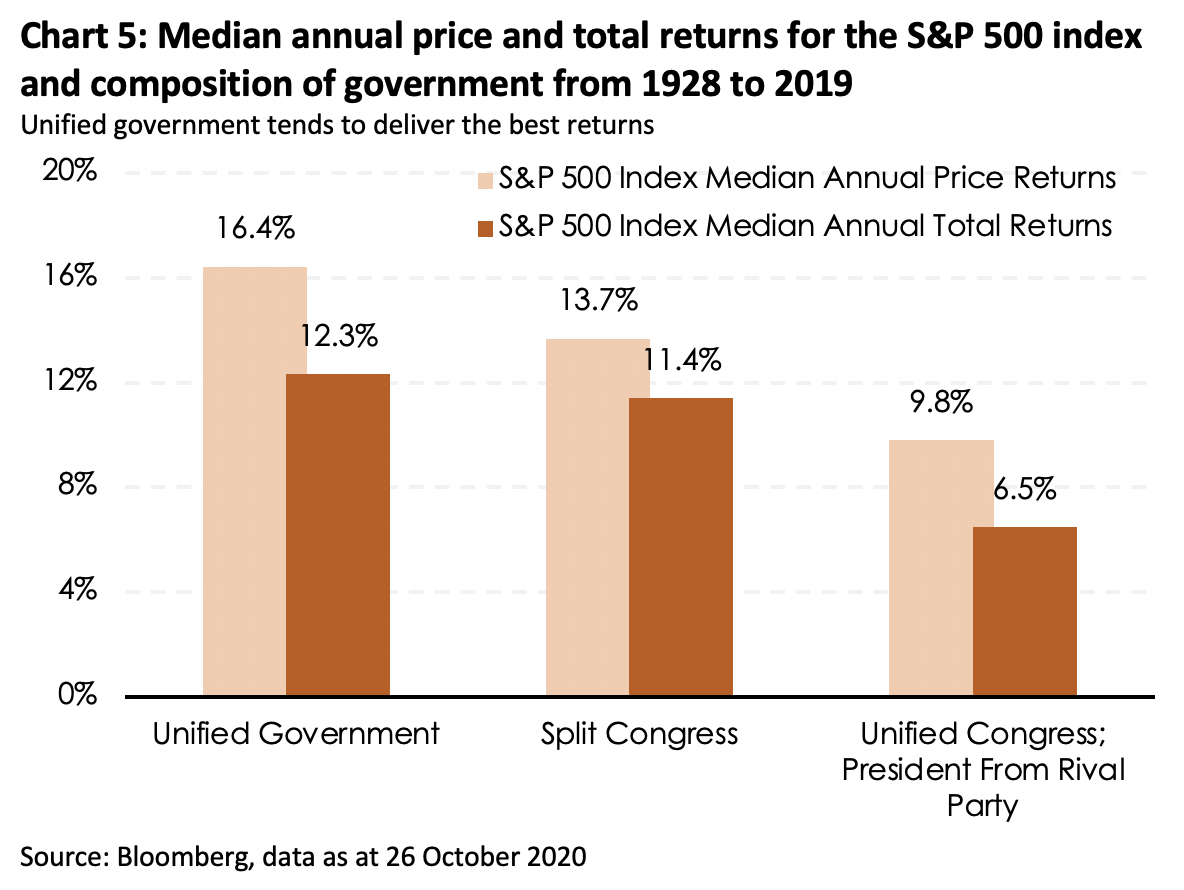
Hence, the lesson is that staying invested pays off over the long-term regardless the composition of the government as politics does not matter all that much for markets across an extended time horizon.
Instead of positioning for any particular outcome, the better strategy is to position portfolios for a rise in volatility, which tends to spike going into such uncertain events. In this case, diversification and exposure to stock names that are not leveraged on any one particular election outcome might be the better way to navigate the potentially rocky road ahead.
The information provided herein is intended for general circulation and/or discussion purposes only. It does not take into account the specific investment objectives, financial situation or particular needs of any particular person.
Please seek advice from a financial adviser regarding the suitability of any investment product taking into account your specific investment objectives, financial situation or particular needs before you make a commitment to purchase any investment product.
The information in this document is not intended to constitute research analysis or recommendation and should not be treated as such. This does not constitute an offer or solicitation to buy or sell or subscribe for any security or financial instrument or to enter into a transaction or to participate in any particular trading or investment strategy.
Some of the contents in this report are summaries of investment ideas and recommendations set out in research reports disseminated by OCBC Bank and its respective associated and connected corporations (“OCBC Group”). For any interest that OCBC Group might have in the securities and/or issuers of the securities, you may request for a copy of the relevant report from your relationship manager.
Any opinions or views of third parties expressed in this material are those of the third parties identified, and not those of OCBC Group.
No representation or warranty whatsoever (including without limitation any representation or warranty as to accuracy, usefulness, adequacy, timeliness or completeness) in respect of any information (including without limitation any statement, figures, opinion, view or estimate) provided herein is given by OCBC Bank and it should not be relied upon as such. OCBC Bank does not undertake an obligation to update the information or to correct any inaccuracy that may become apparent at a later time. All information presented is subject to change without notice. OCBC Bank shall not be responsible or liable for any loss or damage whatsoever arising directly or indirectly howsoever in connection with or as a result of any person acting on any information provided herein.
OCBC Bank, its related companies, their respective directors and/or employees (collectively “Related Persons”) may or might have in the future interests in the investment products or the issuers mentioned herein. Such interests include effecting transactions in such investment products, and providing broking, investment banking and other financial services to such issuers. OCBC Bank and its Related Persons may also be related to, and receive fees from, providers of such investment products.
The information provided herein may contain projections or other forward-looking statement regarding future events or future performance of countries, assets, markets or companies. Actual events or results may differ materially. Past performance figures are not necessarily indicative of future or likely performance. Any reference to any specific company, financial product or asset class in whatever way is used for illustrative purposes only and does not constitute a recommendation on the same.
Investors should note that there are necessarily limitations and difficulties in using any graph, chart, formula or other device to determine whether or not, or if so, when to, make an investment.
The contents hereof are considered proprietary information and may not be reproduced or disseminated in whole or in part without OCBC Bank’s written consent.
Cross-Border Marketing Disclaimers
Please click here for OCBC Bank's cross border marketing disclaimers relevant for your country of residence.