Property Outlook
January 2023
Singapore Property Outlook Q3 2019
Private Residential Prices Improved By 0.9% Q-O-Q
The URA Private Property Price Index increased by 0.9% q-o-q to 152.2 points in Q3 2019.
Market Pulse
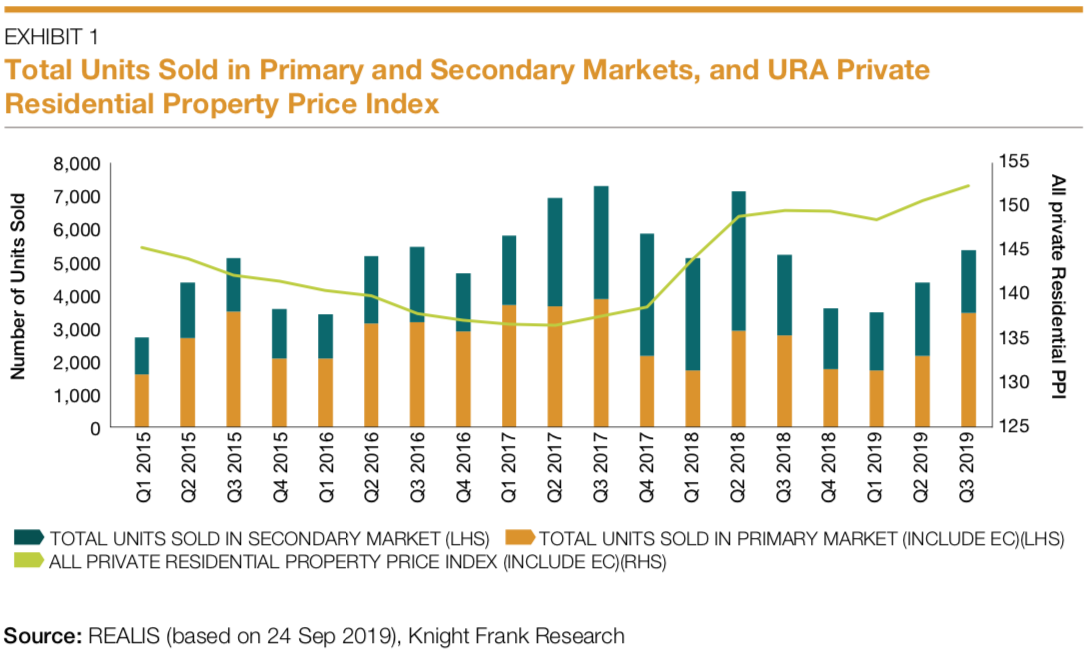
- According to the URA Flash Estimates, the Private Property Price Index (PPI) rose for the second straight quarter by 0.9% quarter-on-quarter (q-o-q) to 152.2 in Q3 2019 (Exhibit 1). While the pace of increase moderated, the second consecutive quarterly improvement in the price index reflected the underlying demand for private residential homes.
- There were 5,380 units transacted in Q3 2019, about 22.5% higher than in Q2 2019 (Exhibit 1). New sales contributed to the increase, recording a 61.0% q-o-q growth with 3,470 units transacted in Q3 2019. Secondary sale transactions, however, decreased by 14.7% q-o-q to 1,910 units in Q3 2019.
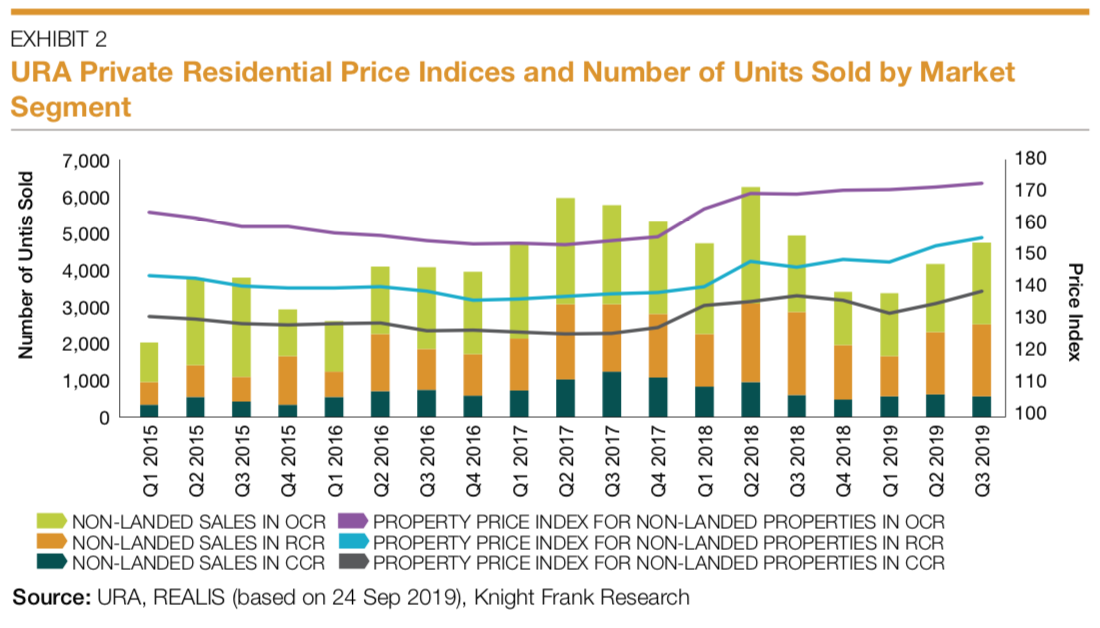
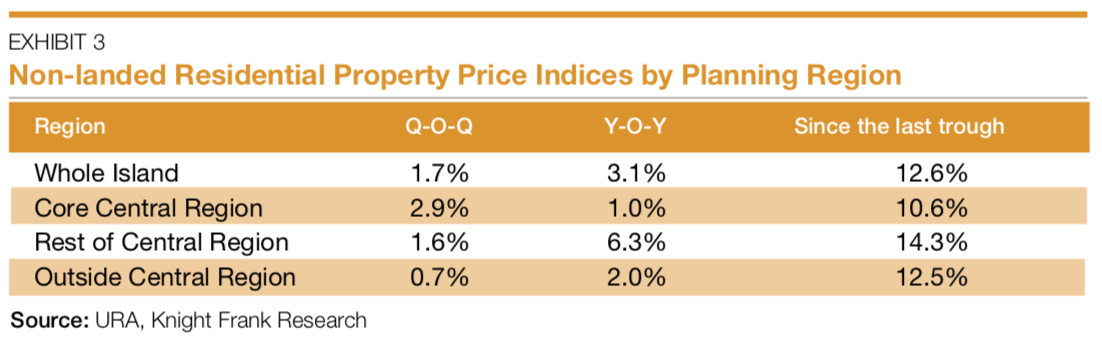
- The price indices for private non-landed properties across all three market segments in Singapore continued to improve, building on the increase in the price index in Q2 2019 (Exhibit 2). The PPI of non-landed private properties in the Core Central Region (CCR) showed the most significant improvement, recording a 2.9% q-o-q growth to 139.2 in Q3 2019 (Exhibit 3). The uncertain economic environment encouraged more home purchases in the CCR because properties in the CCR are often considered as safe assets.
- The PPI of private non-landed properties in the Rest of the Central Region (RCR) increased by 1.6% q-o-q to 155.9 in Q3 2019, albeit slower than the appreciation posted in Q2 2019 (Exhibit 3). Despite the more gradual increase, the prices of private non-landed properties in the RCR was at a record high, with the index being 0.3 points higher than the peak of 155.6 in Q2 2013. Prices in the RCR were also 14.3% higher compared to the last trough in Q4 2016.
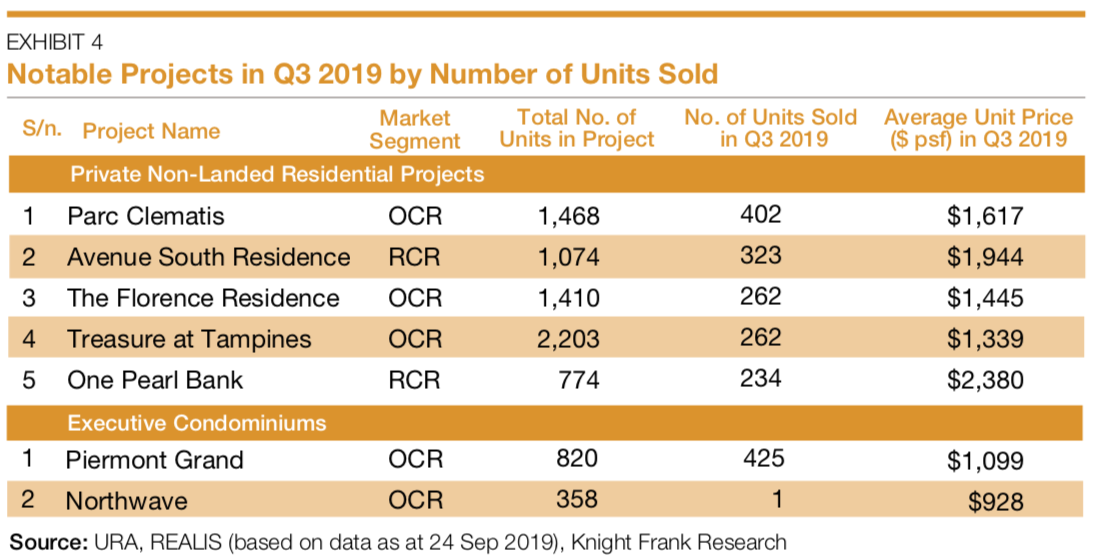
- The increase in the RCR non-landed price index can be partly attributed to the sharing of plans for the Greater Southern Waterfront during the National Day Rally. This announcement pushed up interest in the area, and the new launches in the vicinity sold well in Q3 2019. For instance, Avenue South Residences sold 323 units at an average unit price of $1,943 per sqft in Q3 based on the caveats lodged as at 24th Sep 2019.
- The PPI of non-landed residential properties outside the central region (OCR) increased by 0.7% q-o-q in Q3 2019, slightly higher than the 0.4% q-o-q uptick in Q2 2019 (Exhibit 3).
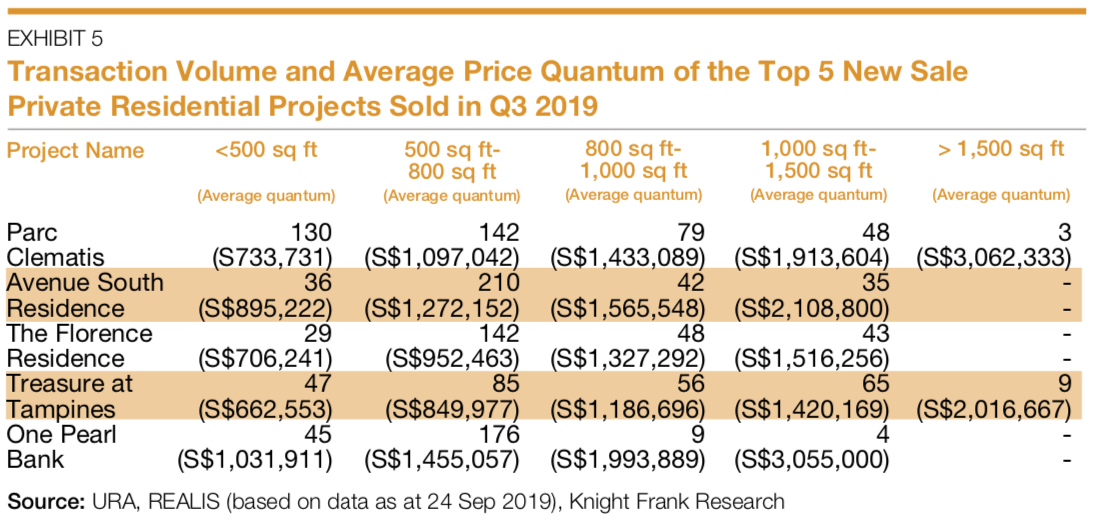
- Out of the top five projects with the most units sold, three were in the OCR (Exhibit 4). Parc Clematis sold the most number of units in Q3 2019, with 402 units sold at an average unit price of S$1,617 per sqft (Exhibit 5). Parc Clematis features communal facilities such as dining pavilions fitted with shared culinary equipment. The project appeals to both buyers and investors, recording strong sales in the one-and two-bedroom units, as well as the bigger apartment types.
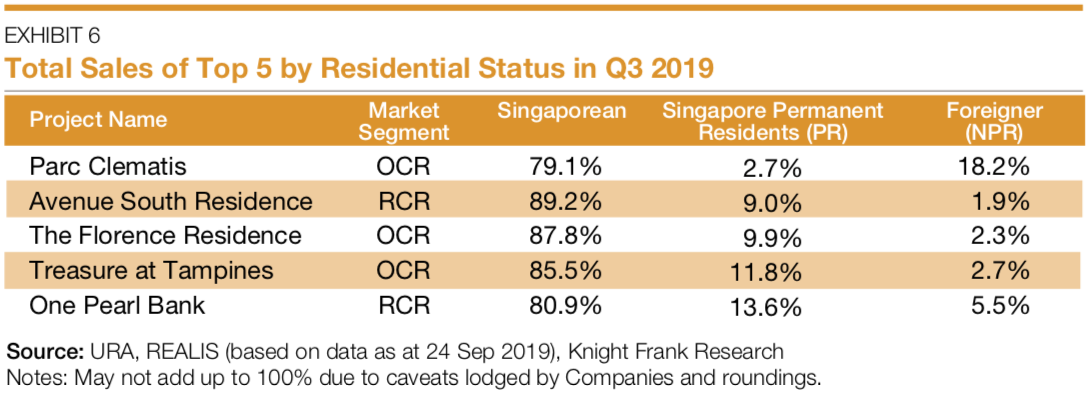
- Singaporean buyers accounted for most of the new home purchases in the top five projects by sales, ranging from 80% to 90% of the units purchased. The top 5 projects appealed to Singaporeans seeking to purchase for occupation because of the location, the potential upside due to government development plans, and the affordable quantum. Out of the top 5 projects, Parc Clematis had the highest proportion of purchases by non-Singaporeans at 18.2% (Exhibit 6). The project appealed to foreign buyers due to its proximity to the National University of Singapore, Jurong East and One-north.
- With vacancy rates staying stable, residential rentals remained flat for the mass market and middle-end private residential properties (Exhibit 7). In contrast, the rents of high-end and ultra-luxury properties appreciated by 6.3% and 10.6% q-o-q, respectively.
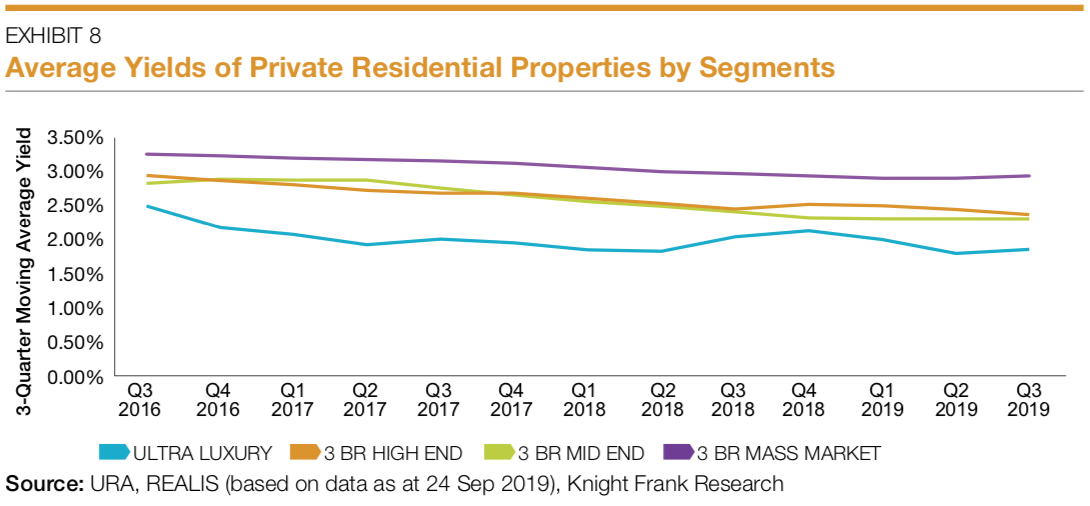
- Rental yields for the mass market, middle-end and high-end residential properties remained mostly stable, but the rental yields for the ultra-luxury properties increased in Q3 2019 after declining in the previous quarter (Exhibit 8).
Market Insights
Private Residential Property Prices increased by 0.9 points q-o-q to 152.2 in Q3 2019. The overall increase in transaction volume stemmed from an increase in the volume of primary sale transactions q-o-q, while the volume of secondary sale transactions saw a q-o-q decrease.
Non-landed sales in the RCR and OCR saw a q-o-q increase in Q3 2019, boosted by new launches such as One Pearl Bank and Parc Clematis.
The price indices of the three market segments continued to increase in Q3 2019, with the price index of non-landed residential properties in the CCR posting the most significant q-o-q increase.
The top 5 residential projects by sales in Q3 2019 appealed to buyers because of their location, the potential upside of their neighbourhood, and their affordability to upgraders and first-time investors. Separately, the Executive Condominium (EC) project Piermont Grand sold 425 units despite the average unit price being above $1,000 per sqft in Q3 2019. Piermont Grand saw brisk sales because of the price gap between condominiums and ECs. The project is likely to see more sales in Q4 with the income ceiling raised from S$14,000 to S$16,000.
Most buyers were still quantum sensitive. Around half of the units sold in the top 5 projects were two-bedroom units (500-800 sqft) with prices between $800,000 to $1,500,000. Approximately 19.4% of the units sold were smaller than 500 sqft, while 15.8% of the units sold were between 800-1000 sqft.
Singaporean citizens accounted for the majority of home sales in the top 5 projects by transaction volume in Q3 2019.
The rents of the non-landed private residential properties in the mass-market and middle-end segment remained mostly flat, while the rents in the high end and ultra-luxury segment increased q-o-q.
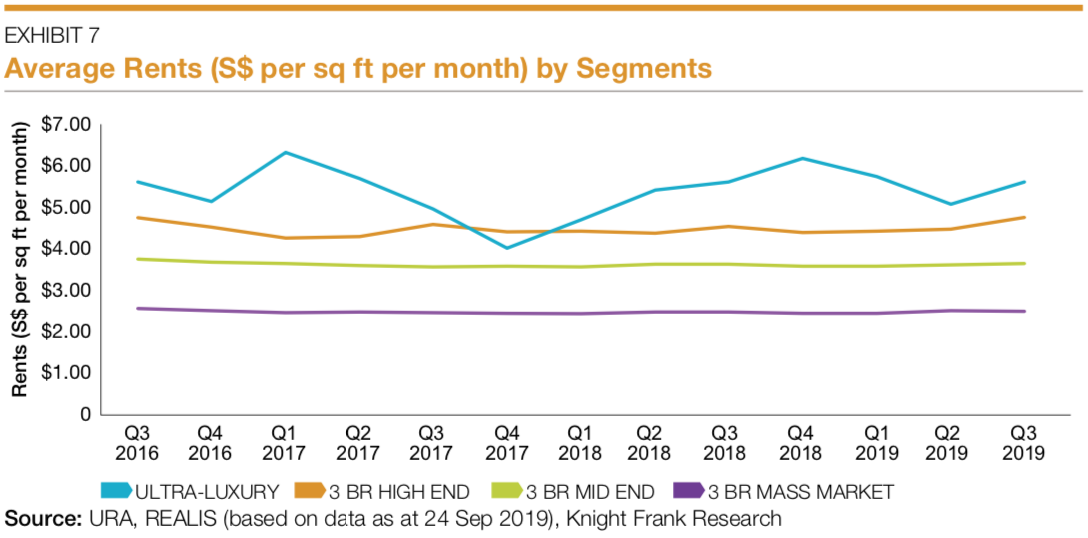
Rents of ultra-luxury residential projects increased q-o-q in Q3 2019 after a decline in the previous quarter.
Market Outlook
The improvement in sales and price indices suggested that the underlying demand for private homes remain robust despite the weaker outlook of Singapore’s economy. The uncertain external environment is likely to encourage more buyers to enter the market in the immediate future because many buyers perceive Singapore properties as safe assets. Foreign purchases of Singapore properties are expected to continue, as they are attracted by Singapore’s stable political environment, pro-business environment, world-class education system and the relatively strong Singapore dollar against regional currencies.
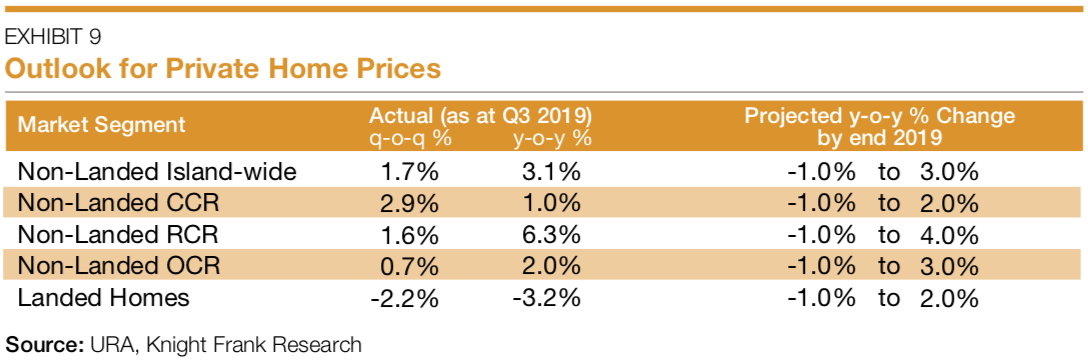
That said, the additional buyers’ stamp duties are likely to cap any improvement in prices. Knight Frank expects sales to improve sustainably y-o-y in Q4 2019, while total new sales in 2019 are forecasted to reach 8,000 to 9,000 units. Secondary sales is likely to fall in the range between 7,000 and 8,000 units.
Article is contributed by Knight Frank.
The information provided herein is intended for general circulation and/or discussion purposes only. It does not take into account the specific investment objectives, financial situation or particular needs of any particular person. The information in this document is not intended to constitute research analysis or recommendation and should not be treated as such.
Without prejudice to the generality of the foregoing, please seek advice from a financial adviser regarding the suitability of any investment product taking into account your specific investment objectives, financial situation or particular needs before you make a commitment to purchase the investment product. In the event that you choose not to seek advice from a financial adviser, you should consider whether the product in question is suitable for you. This does not constitute an offer or solicitation to buy or sell or subscribe for any security or financial instrument or to enter into a transaction or to participate in any particular trading or investment strategy.
The information provided herein may contain projections or other forward looking statement regarding future events or future performance of countries, assets, markets or companies. Actual events or results may differ materially. Past performance figures are not necessarily indicative of future or likely performance. Any reference to any specific company, financial product or asset class in whatever way is used for illustrative purposes only and does not constitute a recommendation on the same. Investments are subject to investment risks, including the possible loss of the principal amount invested.
The Bank, its related companies, their respective directors and/or employees (collectively “Related Persons”) may or might have in the future interests in the investment products or the issuers mentioned herein. Such interests include effecting transactions in such investment products, and providing broking, investment banking and other financial services to such issuers. The Bank and its Related Persons may also be related to, and receive fees from, providers of such investment products.
No representation or warranty whatsoever (including without limitation any representation or warranty as to accuracy, usefulness, adequacy, timeliness or completeness) in respect of any information (including without limitation any statement, figures, opinion, view or estimate) provided herein is given by OCBC Bank and it should not be relied upon as such. OCBC Bank does not undertake an obligation to update the information or to correct any inaccuracy that may become apparent at a later time. All information presented is subject to change without notice. OCBC Bank shall not be responsible or liable for any loss or damage whatsoever arising directly or indirectly howsoever in connection with or as a result of any person acting on any information provided herein.
The contents hereof may not be reproduced or disseminated in whole or in part without OCBC Bank's written consent. The contents are a summary of the investment ideas and recommendations set out in Bank of Singapore and OCBC Bank reports. Please refer to the respective research report for the interest that the entity might have in the investment products and/or issuers of the securities.
This advertisement has not been reviewed by the Monetary Authority of Singapore.
Cross-Border Marketing Disclaimers
Please click here for OCBC Bank's cross border marketing disclaimers relevant for your country of residence.