Is freehold always better than leasehold?
Is freehold always better than leasehold?
Looking at the initial price premium could help you purchase the right property for your investment objectives.
Many have debated whether freehold properties are better than leasehold ones, especially in terms of capital appreciation. The answer may simply lie in the entry price. Owing to their perpetual legal lifespan, freehold properties command a price premium over comparable leasehold properties. The question is what premium would be considered reasonable.
Based on the Singapore Land Authority’s leasehold table, freehold properties command premiums of around 4% to 10% over leasehold properties that have remaining leases of between 80 and 99 years. Actual transactions, however, suggest that paying premiums of up to 20% over comparable leasehold properties is reasonable.
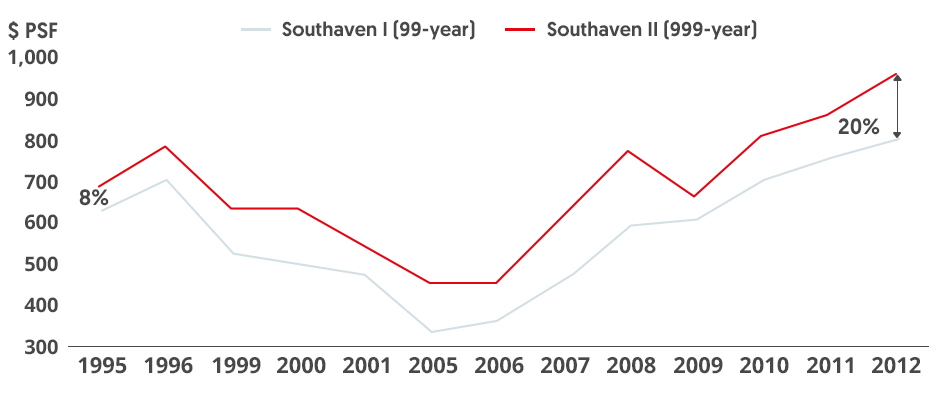
Southaven I and Southaven II offer some clues. The projects are located next to each other on Hindhede Walk and were completed two years apart. However, Southaven I is on a 99-year leasehold site while Southaven II is on a 999-year leasehold site. This study shall treat 999- year leasehold as freehold. The price gap between Southaven I and II was 8% in 1995, the earliest date when official data became available. That year, 39 units at Southaven I sold for $634 psf and 83 units at Southaven II sold for $688 psf. The price gap widened to 20% by 2012 (see Chart 1a). As a result, prices appreciated around 27% at Southaven I to $804 psf and 40% at Southaven II to $962 psf during that period. Although the price gap fluctuated over time and hit 34% in 2005, the median stood at 20% between 1995 and 2012.
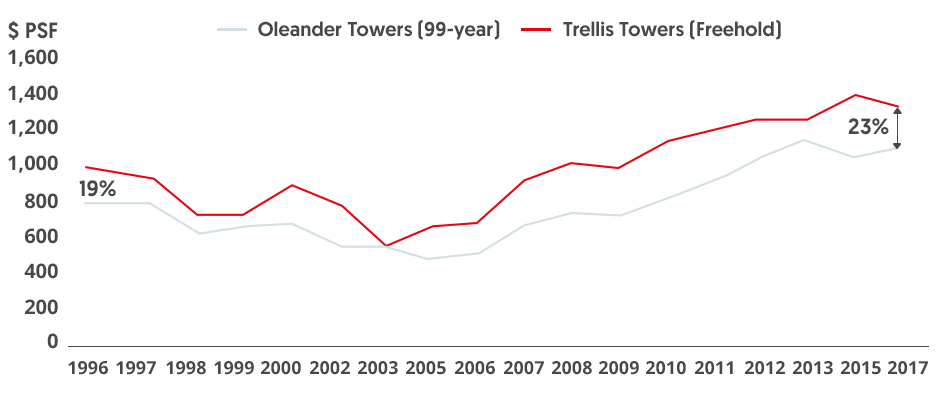
In Toa Payoh, the freehold Trellis Towers commanded an initial price premium of 19% in 1996 over the 99-year leasehold Oleander Towers. The price gap widened to as high as 44% in 2002 although it narrowed again to 23% in 2017, with a median price gap of 31% between 1996 and 2017. Prices appreciated 35% at Oleander Towers and 40% at Trellis Towers in that period (see Chart 1b).
Freehold properties outperformed leasehold properties in capital appreciation when the initial price premium was narrow
 1a
1a
 1b
1b
Only years with at least five transactions for each project were included (Chart: URA and EdgeProp)
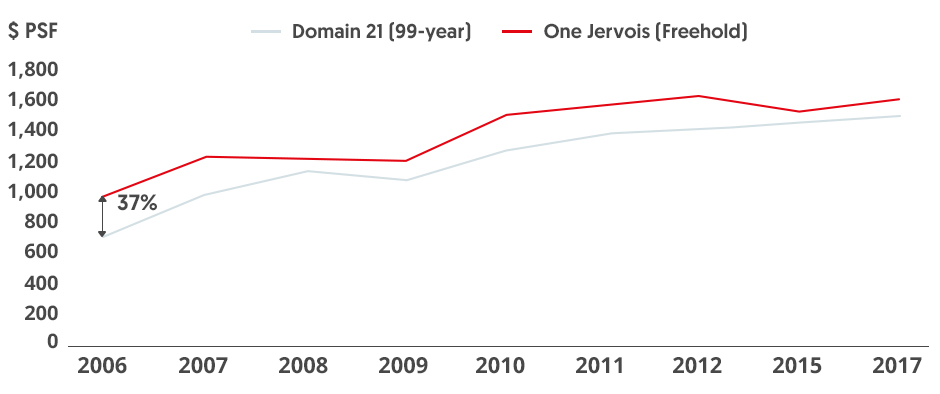
Anecdotal evidence suggests that when the premium exceeds 30%, the capital appreciation for freehold properties could fall behind that for comparable leasehold properties. In 2006, freehold One Jervois commanded an initial price premium of 37% over the 99-year leasehold Domain 21 located nearby. A total of 205 units at One Jervois were sold in that year at an average price of $1,004 psf compared with the $731 psf fetched by 44 units at Domain 21. The premium fell over the years, with a median of 16% between 2006 and 2017. As a result, the capital appreciation for Domain 21 outperformed that of One Jervois during this period (see Chart 2a).
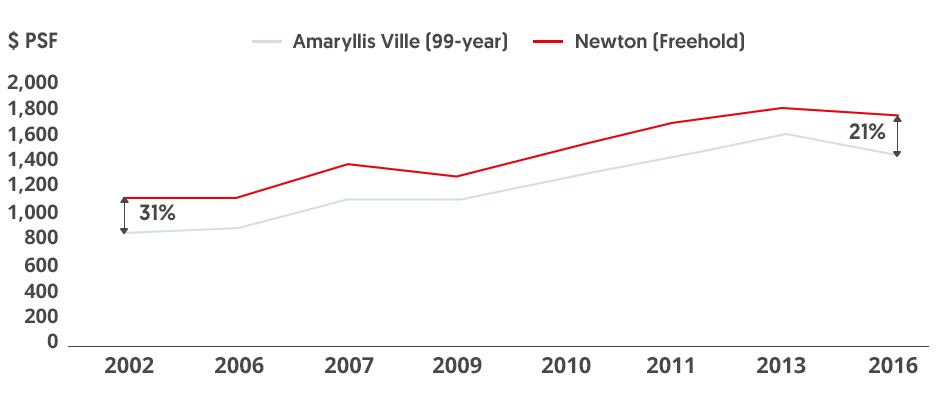
Similarly, prices at 99-year leasehold Amaryllis Ville rose faster than those at Newton 18, a freehold property located next door. In 2002, 59 units at Newton 18 changed hands at an average price of $1,115 psf, or at a 31% premium to the 41 units sold at Amaryllis Ville, which went for $854 psf. The premium also diminished over the years, resulting in a median of 21% between 2002 and 2016. In 2016, prices averaged $1,737 psf at Newton 18 and $1,434 psf at Amaryllis Ville, which translates into capital appreciations of 56% and 68%, respectively, since 2002 (see Chart 2b).
Leasehold properties outperformed freehold properties in capital appreciation when the initial price premium exceeded 30%
 2a
2a
 2b
2b
Only years with at least five transactions for each project were included (Chart: URA and EdgeProp)
With an appropriate entry price, freehold properties offer several key advantages. For one, the government has ceased to offer freehold land parcels for sale. The scarcity factor will make freehold properties an attractive asset class for homebuyers. Currently, freehold properties account for about 49% of total apartment and condominium stock in Singapore, while leasehold properties make up the remainder. The proportion of freehold properties is set to decline as future launches will comprise mainly leasehold projects. Freehold apartments and condos located within walking distance of an MRT station are even more limited, accounting for just 13% of total stock island-wide (see Chart 3).
Stock of apartments and condominiums
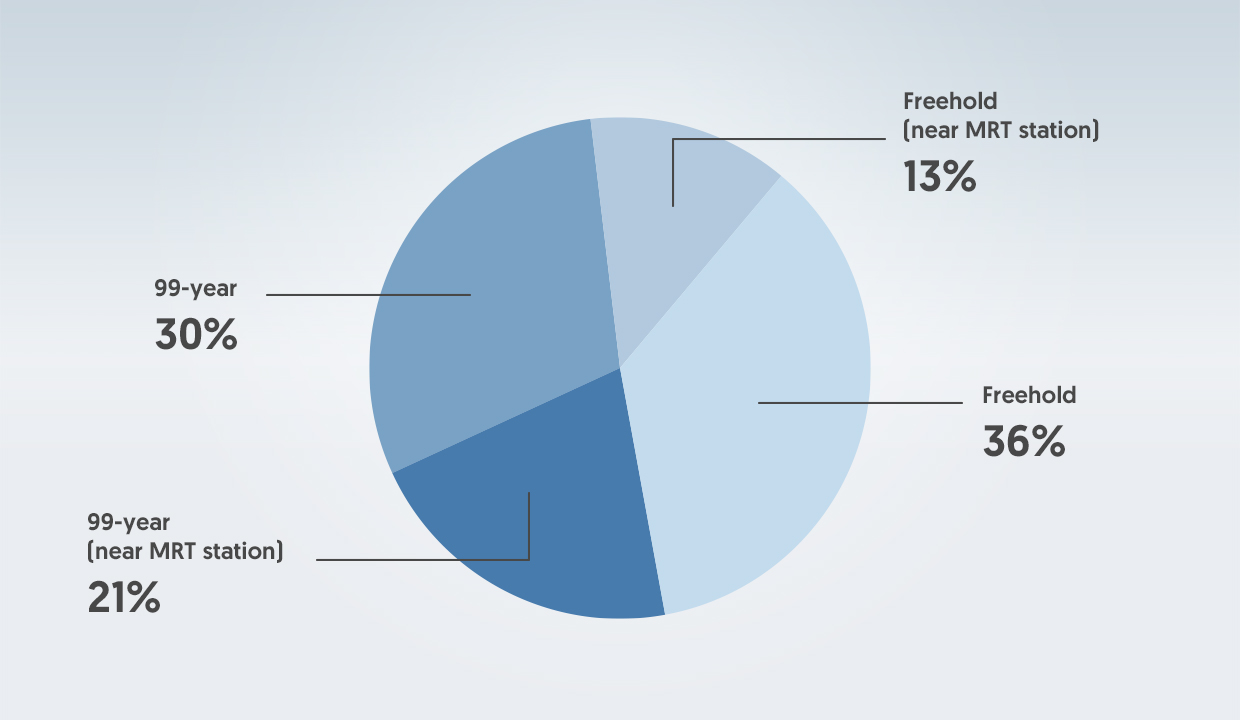
3 (Chart: URA and EdgeProp)
Certain foreign nationalities show a preference for freehold properties. Between January 2016 and August 2017, 71% of transactions were for leasehold properties and 29% for freehold ones. The proportion of freehold transactions, however, was higher among several key foreign purchasers, namely those from Indonesia (40%), the US (41%), the UK (50%), Australia (50%) and Hong Kong (34%). Interestingly, freehold properties accounted for 60% of purchases by companies.
Freehold properties are also said to have better en-bloc potential. A logistic regression analysis shows that tenure is not a statistically significant variable at the 5% level in determining the success of an en-bloc sale. It is, however, an economically significant variable with a large coefficient.
On the flip side, the rental market does not differentiate between the types of tenure of the property. Leasehold properties offer higher rental yields over comparable freehold properties, owing to their discounted prices. The higher yields serve to compensate for their depreciating tenure, higher risks and shorter lifespan to recoup the owner’s capital outlay.
Disclaimer
The information provided herein is for general information only. It does not take into account the specific investment objectives, financial situation or particular needs of any particular person, and does not constitute an offer or solicitation by OCBC Bank to provide loan or financing to any particular person or to enter into a transaction.
No representation or warranty whatsoever in respect of any information provided herein is given by OCBC Bank. All information presented is subject to change without notice. OCBC Bank shall not be responsible or liable for any loss or damage whatsoever arising directly or indirectly howsoever in connection with or as a result of any person acting on any information provided herein. Any reference to any specific entity, authority, area, figures, property or asset class in whatever way is used for illustrative purposes only and does not constitute a recommendation on the same.