Gold’s setback does not signal trend reversal
Gold’s setback does not signal trend reversal
Structural drivers for gold remain intact. Central bank demand, though uneven on a month-to-month basis, continues to reflect broader diversification efforts, and gold’s role as a hedge against geopolitical risk and policy uncertainty remains relevant within diversified portfolios.
Christopher Wong
Executive Director,
OCBC Group Research,
OCBC
Oil
The US-Iran conflict that began on 28 February shows no credible path to de‑escalation. Iran continues to disrupt oil flows through the Strait of Hormuz despite its weaker military position, while Houthi involvement now threatens over 4 million barrels/day at Bab el‑Mandeb.
With Hormuz effectively shut, Saudi Arabia is relying on pipelines rerouting crude to the Red Sea for Asian buyers. Any further disruption in the Red Sea could slow Gulf‑to‑Asia flows to near‑zero.
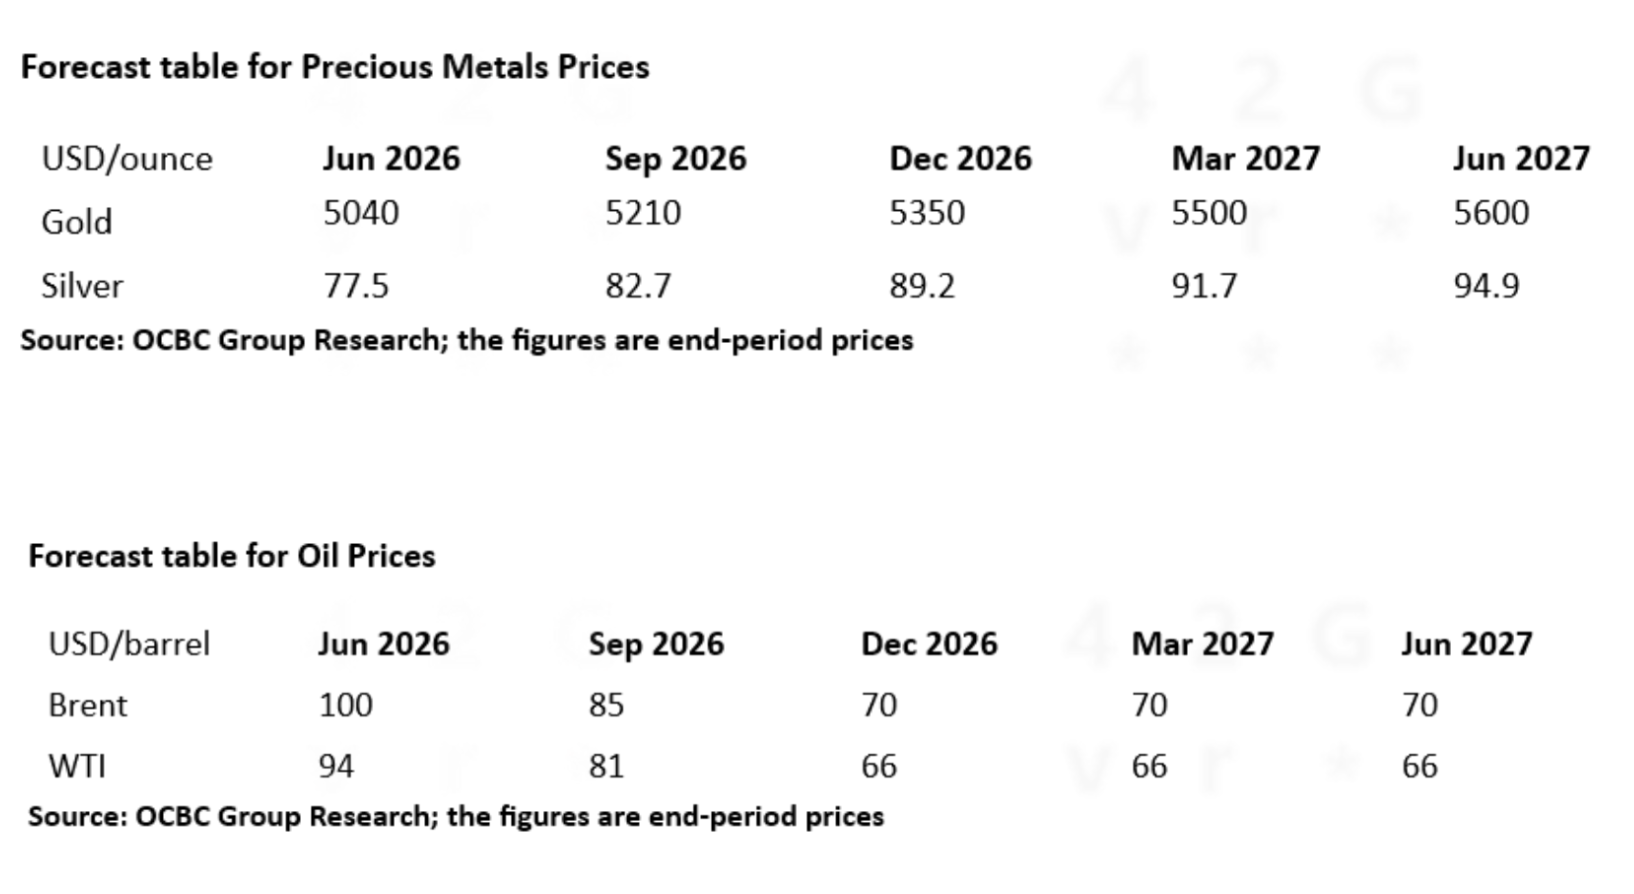
Markets are adjusting to a disruption lasting months, not weeks. Prolonged outages would keep prices elevated, aligned with our base case: Brent near US$100/barrel through mid‑year before easing toward US$70/barrel by early 2027.
Logistical stress is mounting. Shipping delays and near‑full storage are pushing Gulf producers to shut in wells, with restarts that are slow and not guaranteed. This raises the risk that temporary maritime blockages spiral into sustained upstream losses.
Strait of Hormuz remains the world’s most critical oil chokepoint after Strait of Malacca, handling roughly 20 million barrels/day, or 20% of 2024 global consumption. Its disruption poses far greater risk than Suez or Bab el‑Mandeb given limited alternatives.
Saudi and UAE bypass pipelines, International Energy Agency (IEA) reserves, ongoing Iranian exports, and partial Russian sanctions relief offer some cushion — but none can offset a major Hormuz outage.
Precious Metals
Gold
Gold’s sharp pullback in March appears to have been driven less by a deterioration in fundamentals and more by a hawkish repricing of the Fed’s interest rate outlook, position liquidation, and a flush-out of crowded long exposures. At its trough, prices corrected by more than 20% from recent highs, despite elevated geopolitical risks. The primary catalyst was not a collapse in safe-haven demand, but rather a shift in rate expectations. Firmer oil prices and persistent inflation concerns prompted markets to scale back expectations for Fed easing, with pricing moving towards little to no rate cuts in 2026. This lifted real yields and the US Dollar — an environment that typically weighs on gold.
Flow-driven pressures also played a role. Reports of gold sales by Turkey in mid-March, aimed at managing domestic liquidity needs, added to downside momentum. In addition, periods of heightened volatility often trigger a dash for cash, prompting investors to liquidate even traditional safe-haven assets such as gold to raise US Dollar liquidity or meet margin calls. These dynamics exacerbated the selloff and accelerated the unwinding of stale long positions.
Importantly, this episode should be distinguished from 2022. At that time, gold faced a sustained headwind from aggressive Fed tightening and a disorderly rise in real yields. Today, while expectations for rate cuts have been pushed out, the Fed is not on a renewed tightening path, and real rates are not rising in the same destabilising fashion. The current environment is better characterised as a delay in the easing cycle rather than a return to outright tightening, leaving scope for a future dovish repricing.
Should geopolitical tensions de-escalate or growth concerns re-emerge — particularly if elevated energy prices begin to weigh on economic activity — expectations for Fed easing could be restored. In such a scenario, real yields would likely decline, providing renewed support for gold. Meanwhile, structural drivers remain intact. Central bank demand, though uneven on a month-to-month basis, continues to reflect broader diversification efforts, and gold’s role as a hedge against geopolitical risk and policy uncertainty remains relevant within diversified portfolios.
Silver
Silver experienced a particularly sharp pullback in March, with peak-to-trough losses at one point reaching around 35%, as macro headwinds and liquidity pressures overwhelmed near-term support. As with gold, part of the correction reflected a repricing of the US rates outlook. Firmer oil prices reignited inflation concerns and prompted markets to scale back expectations for Fed easing, lifting real yields and the US Dollar. In parallel, silver ETF outflows were observed, adding to selling pressure. This combination weighed on precious metals broadly and was among the key drivers of the selloff in silver.
However, silver’s decline was more pronounced due to its dual role as both a precious and an industrial metal. While elevated geopolitical risks would typically underpin safe-haven demand, concerns that higher energy costs could weigh on global growth introduced an offsetting drag through the industrial demand channel. As a result, silver became more sensitive than gold to shifts in growth expectations during this period of macro stress.
That said, the broader medium-term narrative for silver remains intact. Structural tailwinds, including ongoing supply tightness and its importance in energy transition-related demand, continue to provide support. Moreover, any stabilisation in growth expectations or a moderation in US Dollar strength could help re-anchor prices.
In the near term, silver is likely to remain volatile and range-bound, caught between competing forces. The interplay between USD strength, elevated real yields, and growth concerns on one hand, and structural demand support and the potential for renewed policy repricing on the other, points to a lack of clear directional conviction.
The trajectory of the Iran conflict will be a key variable. Further escalation would likely sustain volatility through oil markets and broader macro channels, while any signs of de-escalation could prompt a partial reversal in USD strength and rate expectations, providing support for silver.
Currency
US Dollar (USD)
We have revised our currency forecasts to reflect a stronger near‑term US Dollar (USD). The recent energy shock has upended the earlier “Goldilocks” narrative of firming non‑US growth and easing global inflation. Markets are now trading energy terms‑of‑trade winners and losers, alongside renewed stagflation concerns. The USD remains the preferred risk‑off hedge — especially when the shock, like current energy shock, is global rather than US‑specific. Its status as a net energy‑exporter currency adds to its appeal.
A softer USD later this year remains plausible if oil prices fall as expected in the second half, boosting non‑US growth while ongoing US policy uncertainty continues to encourage diversification away from the USD. Even so, resilient US economic performance limits the scope for any sharp USD decline. A more sustained USD rebound would require a clear acceleration in US growth — something still missing for now — although early signs of labour market stabilisation could support a gradual recovery heading into 2027.
Australian Dollar (AUD)
Risk‑off sentiment stemming from the energy shock has weighed on the risk-sensitive Australian Dollar (AUD), despite Australia’s role as a major natural‑gas exporter. While uncertainty remains elevated, we stay constructive on the currency and now expect the AUDUSD to reach 0.75 by end‑2026. Australia’s above‑target inflation and resilient domestic activity have prompted a more hawkish RBA response. Although markets have largely priced in further rate hikes, their actual delivery should still support the AUD through strengthened central bank credibility. Importantly, Australia’s hawkish rate pricing appears more durable than Europe’s, given the economy’s relative insulation from energy supply risks. Structural flows add further support. Australian super‑fund hedge ratios continue to drift higher, with media reports signalling additional increases ahead. These flows should provide a steady tailwind for the AUD.
Asia ex-Japan
Asia ex-Japan (AXJ) currencies (FX) continued to trade on a softer footing, with the Bloomberg Asia Dollar index weakening since the onset of Iran conflict. Risk sentiment remains fragile as markets take into consideration some slight repricing in growth risks. The situation in the Middle East continues to evolve, and importantly, the risk is no longer confined to the Strait of Hormuz but increasingly there is risk of disruption at Bab el-Mandeb as the Iran conflict widens to involve Houthi militants and US ground troops potentially.
Macro strains may already start to show up across the Asian region as policy responses are becoming more visible. Rising costs of food, fertiliser and shipping risks fuelling inflationary pressure. Tourism is also at risk as higher travel costs and weaker sentiment can hit a key income buffer for ASEAN. And the region’s fiscal buffers can also be affected if the supply disruption is prolonged.
In AXJ FX, there is a repricing of global growth risks. What is notable this time is that commodity-linked currencies such as the Malaysian Ringgit (MYR) has come under pressure as markets focus less on terms-of-trade support and more on the demand shock. There is a shift in market narrative from terms of trade support to concerns if global demand can hold up under tighter financial conditions and rising energy costs.
Against this backdrop, the near-term outlook for AXJ FX remains skewed to the downside. While episodic rebounds are not ruled out, especially on headlines hinting at de-escalation, the absence of a clear resolution means most AXJ FX is likely to trade under pressure with policy responses only partially cushioning the downside rather than reversing it. We have revised downwards our AXJ FX forecasts to reflect slight growth concerns, a stronger USD and weaker risk sentiment as the Middle East conflict persists for longer than expected. That said we have kept the forecast trajectory for USDAXJ modestly skewed to the downside into 2H 2026, premised on the prospects for fading of supply chain disruption, the Fed following through with a rate cut this year (we expect one rate cut in 2026) and an easing of USD strength.
In relative terms, the Singapore Dollar (SGD) and Renminbi (RMB) may be less affected but not immune. This likely reflects the more managed nature of their exchange rate regimes, where policy guidance can dampen volatility. That said, on RMB we have observed that the fixing pattern has started to shift. The 30-day rolling average of daily fixing change for the USDCNY has been reduced to -7pips (31 March) vs -33pips (in early March). The timing of the moderation in the pace of fixing has resulted in the USDRMB bottoming around the 6.88 levels recently. The fixing pattern requires further monitoring — to assess if there is any intent to inject modest two-way volatility to temporarily slow the pace of RMB appreciation, or if it indeed represents a shift in policymakers’ preference for the RMB’s appreciation path.
US Dollar (USD) and Singapore Dollar (SGD)
USDSGD (Singapore Dollar) continued to trade higher in March. A stronger USD, a paring back of Fed rate-cut expectations, a repricing of global growth and a moderation in the pace of RMB appreciation were some of factors that contributed to SGD weakness. That said, the SGD’s depreciation pales in comparison to its peers like the Korean Won, Thai Baht, Philippines Peso, the Indian Rupee. On the upcoming MAS policy decision in April, we expect the MAS to tighten policy by steepening the S$NEER (Singapore dollar nominal effective exchange rate) policy band slope. That said, we believe all policy options are on the table especially if imported inflationary pressure is assessed to broaden or influence inflation expectations significantly.
Malaysian Ringgit (MYR)
The Malaysian Ringgit’s (MYR) losses played catch-up with other Asian currencies in the second half of March after holding up (on relative terms) in the first two weeks of March. The decline in the MYR shows that no currency is immune from geopolitical shocks even as Malaysia’s position as a net commodity exporter can support the MYR. The MYR can still soften in broader risk-off environments given its exposure to global growth, risk sentiment and portfolio flows.
US Dollar (USD) and Indonesian Rupiah (IDR)
USDIDR (Indonesian Rupiah) continued to edge modestly higher in March, reflecting a still-challenging external backdrop marked by a firmer USD, risk-off sentiment and oil-related terms-of-trade pressures. BI’s rollout of FX repo via FX-denominated instruments such as SVBI and SUVBI should help mitigate volatility at the margin. While these tools do not alter the underlying FX rate anchor, the measures may improve how USD liquidity is intermediated onshore. By allowing exporters and banks to hold and recycle USD domestically, the need to source USD aggressively via the spot market is reduced, thereby partially help to ease pressures and limit the risk of disorderly overshoots in the USDIDR. Earlier, BI had also announced FX market transaction measures, targeted to support the IDR. These include lowering the FX cash purchase limit to US$50,000 (from US$100,000) per buyer per month (any higher than the US$50,000 would require supporting documentation), increasing the transaction limits for Domestic Non-Deliverable Forward (DNDF)/Forward sales and Swap buy-and-sell from US$5 million to US$10 million per transaction, and adjusted the threshold for supporting documents for outgoing FX fund transfers to US$50,000 (from US$100,000). These will take effect in April and appears targeted at reducing non-essential USD demand while facilitating hedging activity. Potentially, these can help to reduce pressure on the spot market and improve onshore USD liquidity conditions. That said, external factors remain the dominant driver, and weaker risk sentiment alongside elevated oil prices amid the risk of a more protracted Iran conflict are still likely to weigh on IDR.


Important information
The information provided herein is intended for general circulation and/or discussion purposes only. It does not take into account the specific investment objectives, financial situation or particular needs of any particular person. The information in this document is not intended to constitute research analysis or recommendation and should not be treated as such.
Without prejudice to the generality of the foregoing, please seek advice from a financial adviser regarding the suitability of any investment product taking into account your specific investment objectives, financial situation or particular needs before you make a commitment to purchase the investment product. In the event that you choose not to seek advice from a financial adviser, you should consider whether the product in question is suitable for you. This does not constitute an offer or solicitation to buy or sell or subscribe for any security or financial instrument or to enter into a transaction or to participate in any particular trading or investment strategy.
The information provided herein may contain projections or other forward looking statement regarding future events or future performance of countries, assets, markets or companies. Actual events or results may differ materially. Past performance figures are not necessarily indicative of future or likely performance. Any reference to any specific company, financial product or asset class in whatever way is used for illustrative purposes only and does not constitute a recommendation on the same. Investments are subject to investment risks, including the possible loss of the principal amount invested.
The Bank, its related companies, their respective directors and/or employees (collectively “Related Persons”) may or might have in the future interests in the investment products or the issuers mentioned herein. Such interests include effecting transactions in such investment products, and providing broking, investment banking and other financial services to such issuers. The Bank and its Related Persons may also be related to, and receive fees from, providers of such investment products.
No representation or warranty whatsoever (including without limitation any representation or warranty as to accuracy, usefulness, adequacy, timeliness or completeness) in respect of any information (including without limitation any statement, figures, opinion, view or estimate) provided herein is given by OCBC Bank and it should not be relied upon as such. OCBC Bank does not undertake an obligation to update the information or to correct any inaccuracy that may become apparent at a later time. All information presented is subject to change without notice. OCBC Bank shall not be responsible or liable for any loss or damage whatsoever arising directly or indirectly howsoever in connection with or as a result of any person acting on any information provided herein.
The contents hereof may not be reproduced or disseminated in whole or in part without OCBC Bank's written consent. The contents are a summary of the investment ideas and recommendations set out in Bank of Singapore and OCBC Bank reports. Please refer to the respective research report for the interest that the entity might have in the investment products and/or issuers of the securities.
Investments are subject to investment risks, including the possible loss of the principal amount invested. The information provided herein may contain projections or other forward-looking statements regarding future events or future performance of countries, assets, markets or companies. Actual events or results may differ materially. Past performance figures, predictions or projections are not necessarily indicative of future or likely performance.
This advertisement has not been reviewed by the Monetary Authority of Singapore.
This document may be translated into the Chinese language. If there is any difference between the English and Chinese versions, the English version will apply.
Foreign Currency disclaimer
- Foreign currency investments or deposits are subject to inherent exchange rate fluctuation that may provide opportunities and risks. Consequently, exchange rate fluctuations may affect the value of your foreign currency investments or deposits.
- Earning on foreign currency investments or deposits may change depending on the exchange rates prevalent at the time of their maturity if you choose to convert.
- Exchange controls may apply to certain foreign currencies from time to time.
- Any pre-termination costs will be taken and deducted from your deposit directly and without notice.
Cross-Border Marketing Disclaimers
OCBC Bank's cross border marketing disclaimers relevant for your country of residence.
Collective Investment Schemes
- A copy of the prospectus of each fund is available and may be obtained from the fund manager or any of its approved distributors. Potential investors should read the prospectus for details on the relevant fund before deciding whether to subscribe for, or purchase units in the fund.
- The value of the units in the funds and the income accruing to the units, if any, may fall or rise. Please refer to the prospectus of the relevant fund for the name of the fund manager and the investment objectives of the fund.
- Investment involves risks. Past performance figures do not reflect future performance.
- Any reference to a company, financial product or asset class is used for illustrative purposes and does not represent our recommendation in any way.
- For funds that are listed on an approved exchange, investors cannot redeem their units of those funds with the manager or may only redeem units with the manager under certain specified conditions. The listing of the units of those funds on any approved exchange does not guarantee a liquid market for the units.
- The indicative distribution rate may not be achieved and is not an indication, forecast, or projection of the future performance of the Fund.
Any opinions or views of third parties expressed in this document are those of the third parties identified, and do not represent views of Oversea-Chinese Banking Corporation Limited (“OCBC Bank”, “us”, “we” or “our”).